Query Builder
Start exploring your data with the Query Builder. Hunt for threats, obtain analytics, and create insightful dashboards and reports. The Query Builder is a simple tool that allows you to build queries to explore your data effectively.
With this form, you can aggregate data to extract new insights, helping you make informed decisions. Additionally, the Query Builder enables the visualization of data through various types of charts, enriching your reporting capabilities.
Currently, the Alerts data source is available, along with the Events source and the Cases source, with plans to introduce more sources in the future.
Query listing
The Queries page provides an overview of all available queries. Use the table columns to track the origin and usage of each query.
Query table columns
| Column | Description |
|---|---|
| Author | The original creator of the query. |
| Edited by | The last user who modified the query. |
| Created by | The user who first saved the query. |
| Available in... | The number of dashboards currently using this query. |
| Shared by | The workspace or entity that shared the query with your community. |
Query types
| Type | Description |
|---|---|
| Personal | Queries created by you. |
| Community | Queries created by members of your community. |
| Shared | Queries shared with your community by a parent workspace. |
Build your query
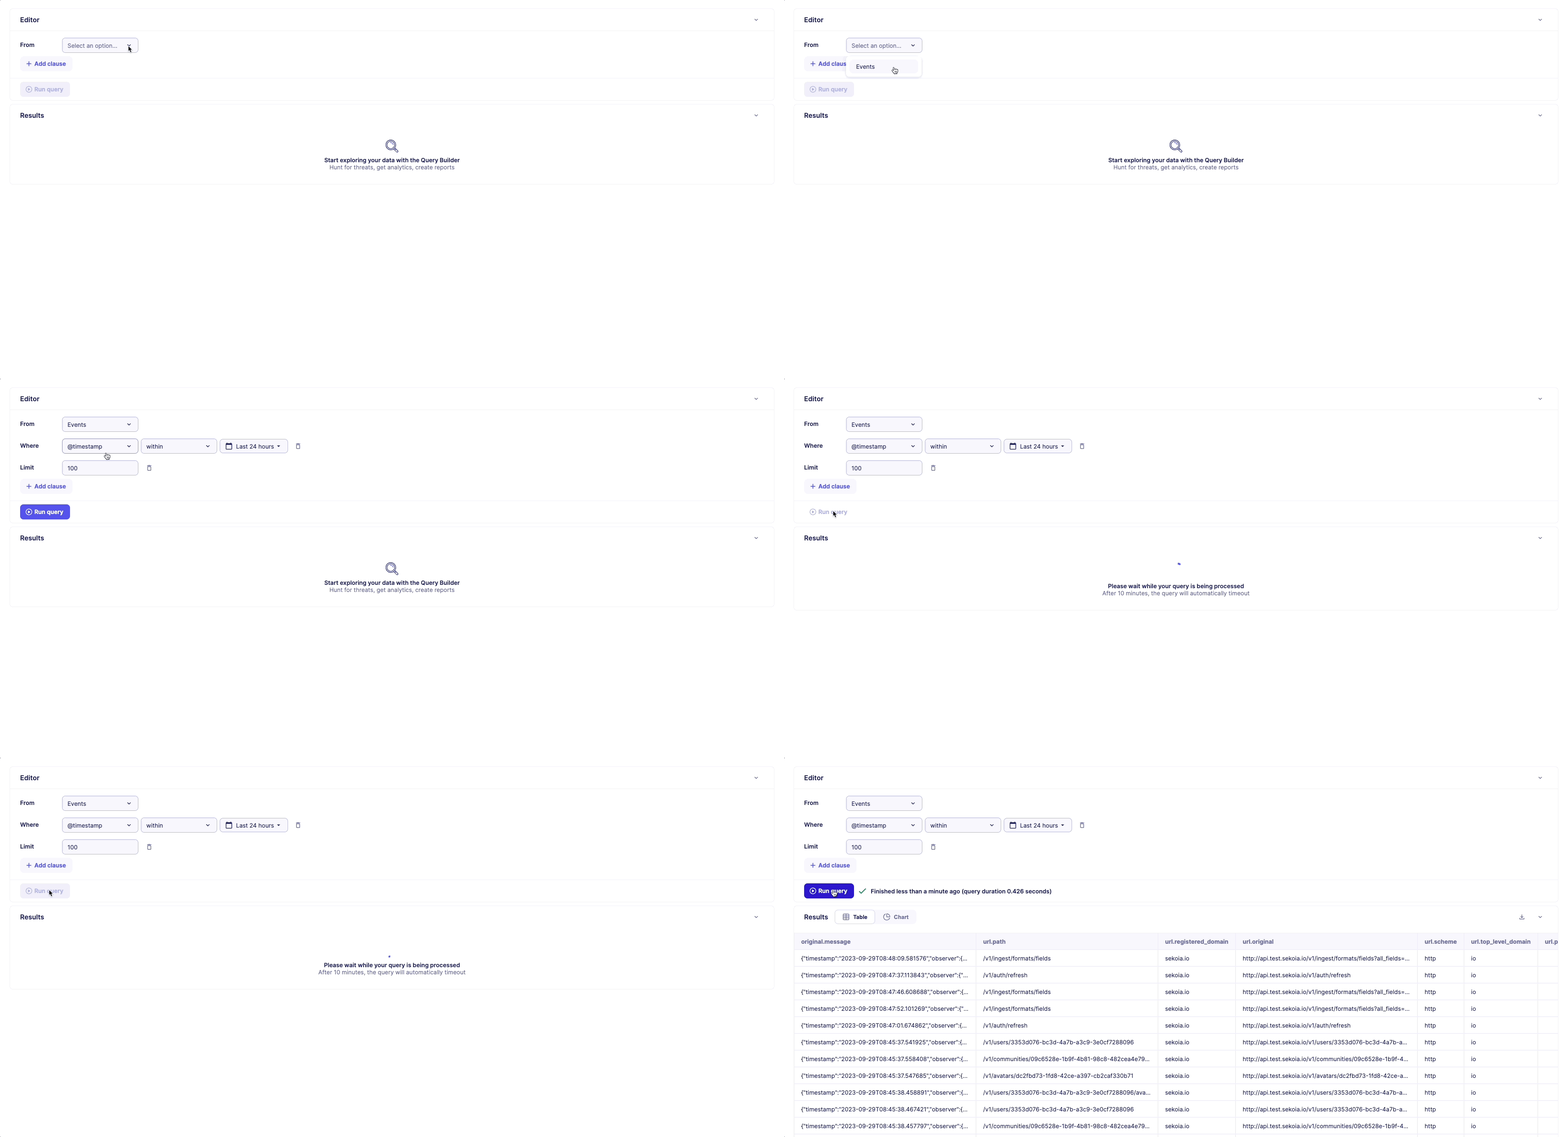
Select a data source to query in the From clause and use Add clause button to refine your query.
The Query Builder comes with the following clauses:
| Clause | Description |
|---|---|
| SELECT | Choose columns you want to display |
| AGGREGATION | Aggregate rows with average / count / min / max / sum / unique count |
| WHERE | Define query conditions |
| GROUP BY | Group rows by identical data |
| ORDER BY | Order rows by a specific value |
| LIMIT | Limit the number of rows in results |
Aggregation
Create an aggregation by using the Aggregate clause. Select a type of aggregation, a column and a label for your aggregation.
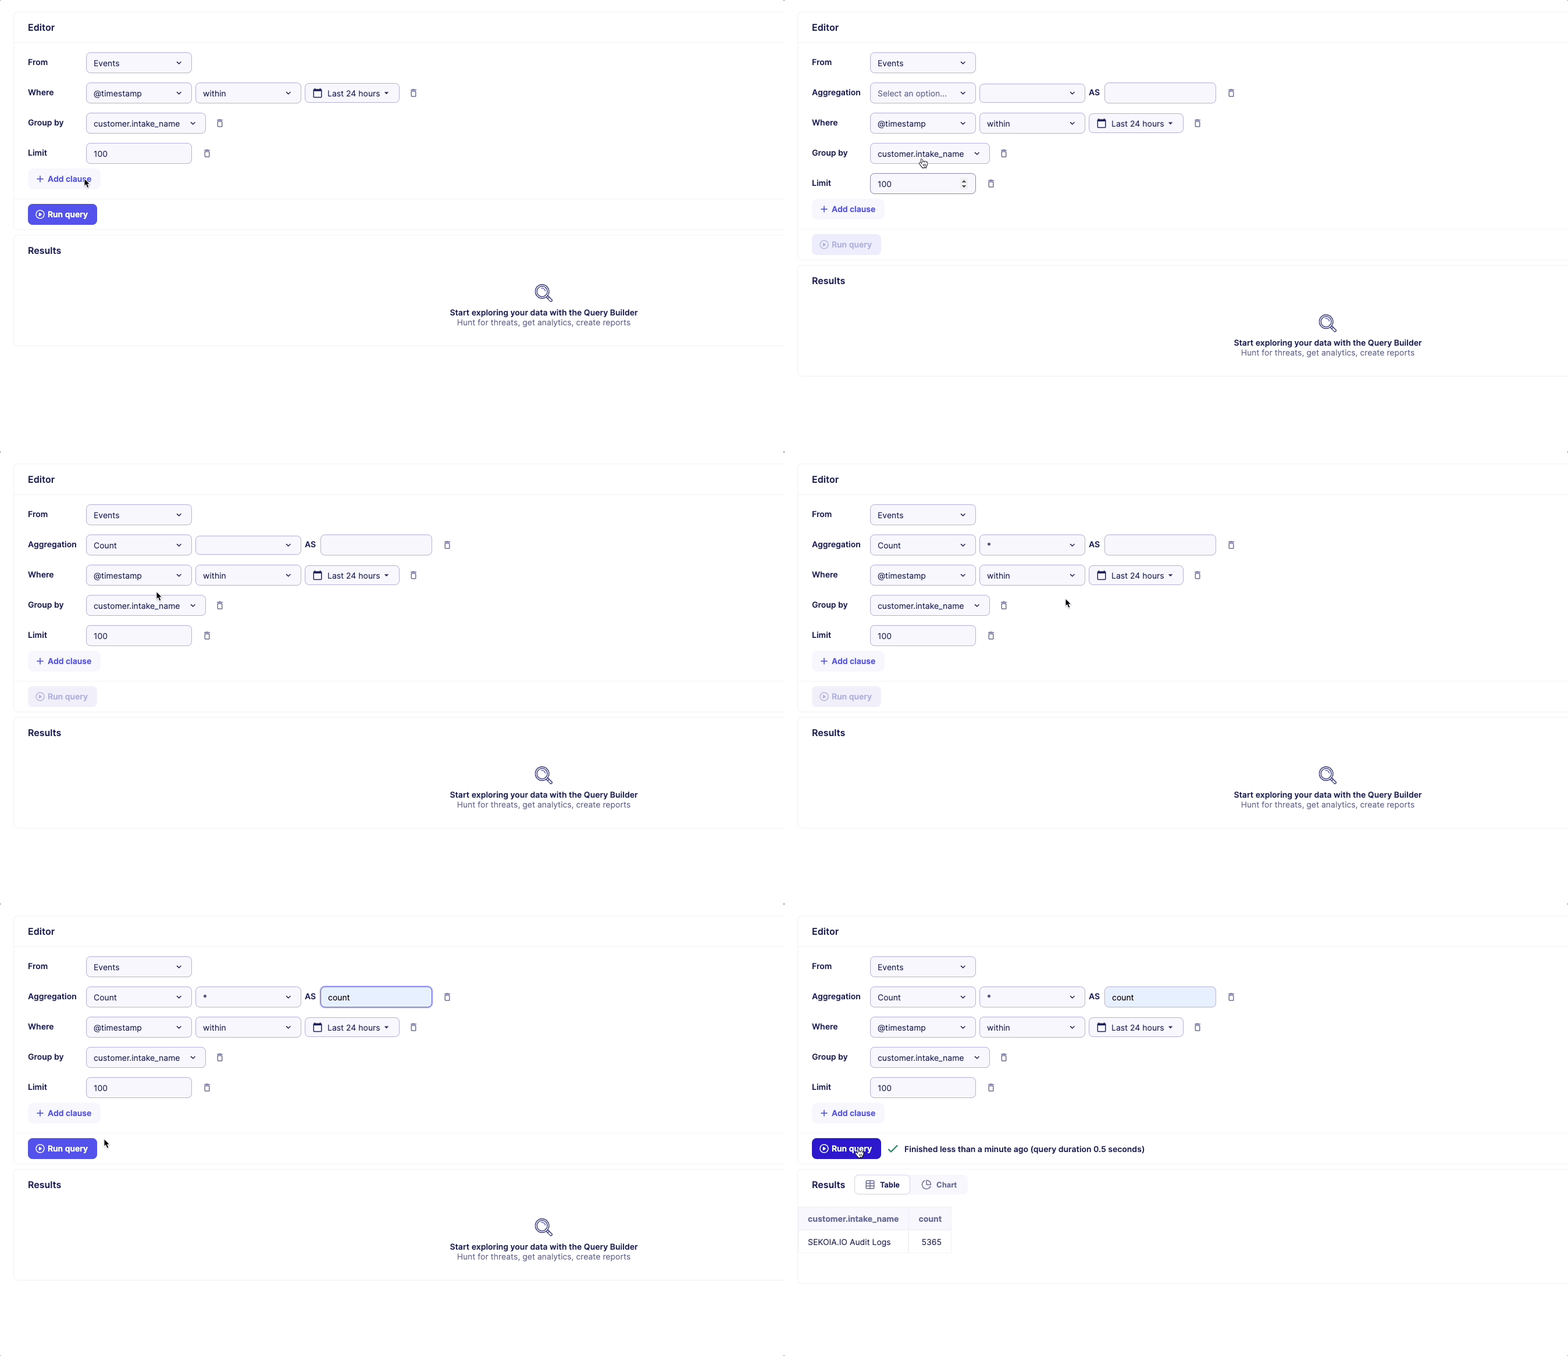
The following aggregation types are available.
| Aggregation type | Description |
|---|---|
| Average | Average of a set |
| Count | Count the number of rows in a set |
| Min | Find the minimum value in a set |
| Max | Find the maximum value in a set |
| Sum | Sum of a set |
| Unique count | Count unique values of a set |
Operators
Use the following operators to define your conditions in the WHERE clause.
| Operator | Description |
|---|---|
| is | Equals (case-sensitive) |
| is not | Not equals (case-sensitive) |
| starts with | Starts with the specified value (case-sensitive) |
| does not start with | Does not start with the specified value (case-sensitive) |
| ends with | Ends with the specified value (case-sensitive) |
| does not end with | Does not end with the specified value (case-sensitive) |
| contains | Contains the specified value (case-sensitive) |
| does not contain | Does not contain the specified value (case-sensitive) |
| exists | Has a value |
| does not exists | Does not have a value |
| within | Within the specified date range |
| < | Strictly less than |
| <= | Less than or equal to |
| > | Strictly more than |
| >= | More than or equal to |
Alert properties
When using the Query Builder with Alerts as a source, users can filter and manipulate queries based on the following alert properties:
| Alert Property | Description |
|---|---|
| Creation date | The date and time when the alert was initially created. |
| Update date | The date and time when the alert was last updated. |
| Entity UUID | A unique identifier representing the entity associated with the alert. |
| Entity name | The name of the entity linked to the alert. |
| Rule UUID | A unique identifier for the rule that generated the alert. |
| Rule name | The name assigned to the rule that triggered the alert. |
| Status | The current state of the alert (e.g., open, acknowledged, resolved). |
| Urgency | The level of urgency assigned to the alert. |
| Similar | Properties related to similar alerts. |
| Short ID | A concise identifier for quick reference to the alert. |
| Time to detect | Duration taken to identify the alert from its occurrence in seconds. |
| Time to acknowledge | Time elapsed from detection to official acknowledgment of the alert in seconds. |
| Time to respond | Duration taken to take action after acknowledgment in seconds. |
| Time to resolve | The total time taken to completely resolve the alert in seconds. |
| Time to ingest | The duration from alert generation to its final ingestion into the system in seconds. |
| Detection type | The method by which the alert was detected. |
| Community UUID | A unique identifier for the community the alert belongs to. |
Case properties
When using the Query Builder with Cases as a source, users can filter and manipulate queries based on the following case properties:
| Property | Description |
|---|---|
| Case Status Name | The name of the status associated with the case. |
| Community UUID | A unique identifier for the community related to the case. |
| Created at | The date and time when the case was created. |
| Created by | The user or system that created the case. |
| Created by type | The type of entity that created the case (e.g., user, automated system). |
| Description | A detailed description outlining the case's context or issues. |
| First seen at | The date and time when the case was first detected. |
| Last seen at | The date and time when the case was last observed or updated. |
| Priority | The importance level assigned to the case, indicating its urgency. |
| Short ID | A concise identifier for quick reference to the case. |
| Tags | The names of tags associated with the case for categorization and filtering. |
| Title | The title or subject line of the case. |
| Updated at | The date and time when the case was last updated. |
| Updated by | The user or system that last updated the case. |
Query results
To view the results of your query, simply click on Run query.

You have various options for displaying your results, depending on your needs. Below, you can explore the different types of visualizations available.
The query builder offers six visualization options, grouped into two categories:
1. Total values: This category focuses on comparing values across different categories at a specific point in time.
Examples of total value visualizations:
- Number
- Table
- Pie Chart
- Bar Chart
2. Time series: This category highlights how data evolves over time, enabling the analysis of trends and changes.
Examples of time series visualizations:
- Bar Chart
- Line Chart
Choose the visualization type that best fits your data analysis needs!
Total values
Number
The Number visualization prominently displays a single numeric value, making it perfect for showcasing key performance indicators (KPIs) or other important metrics.
To use the Number visualization, your query must result in only one numerical value. It cannot be used if the query returns multiple values.
Table
The Table view provides a comprehensive display of raw numerical values for each category across the entire date range. This format allows for direct comparison of total values across different categories.
Currently, the maximum number of rows that can be processed is 10 000.
Pie Chart
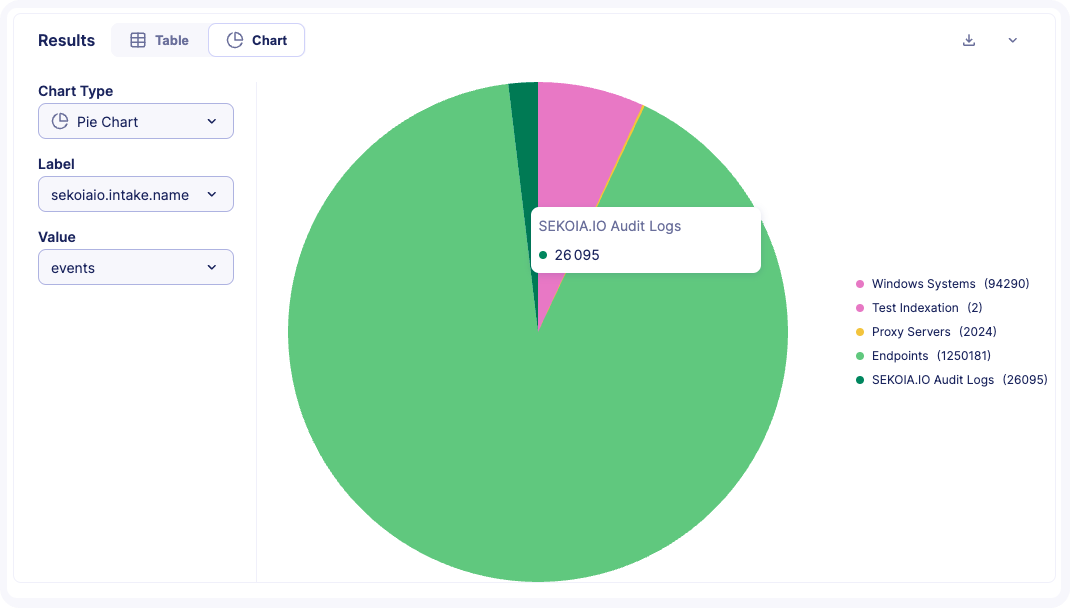
The Pie Chart visualization illustrates how a total amount is divided among distinct groups. To ensure clarity in display, the maximum number of values allowed in a pie chart is limited to 40.
- In the Label field, select the column you want to use for labeling each section of the pie chart.
- In the Value field, select the column that represents the numerical value for each section.
Whenever possible, we will attempt to automatically select appropriate columns for you.
Bar Chart
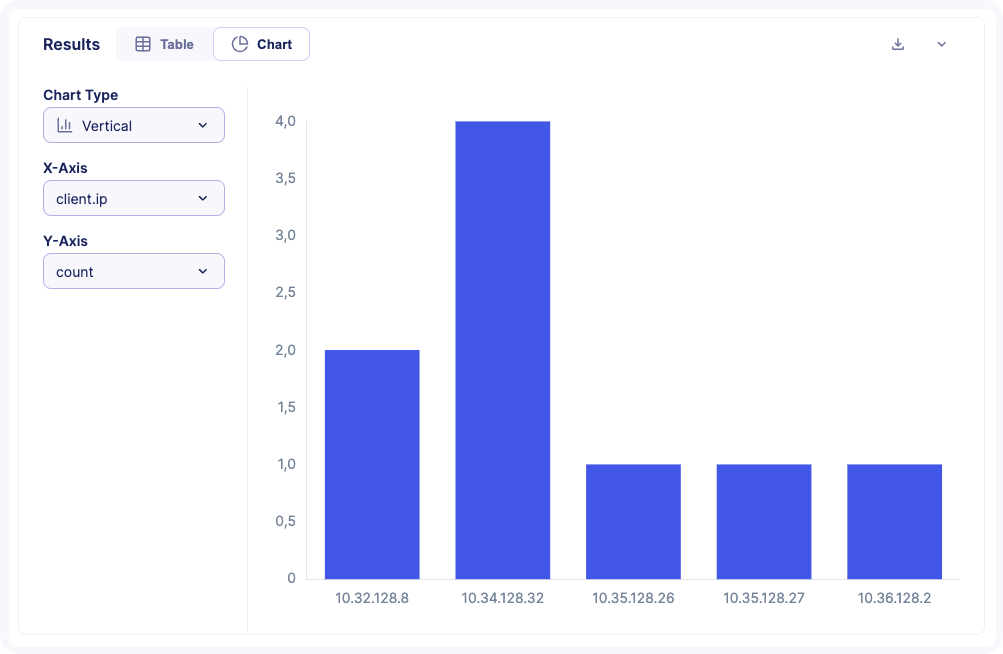
The Vertical Bar Chart allows you to compare values across different groups effectively. To ensure a clear display, the maximum number of values allowed in the vertical bar chart is limited to 80.
- In the X-axis, select the column you want to use for grouping. This column can be of any data type.
- In the Y-axis, select the column that represents the numeric values. This column must contain numeric data.
This format is ideal for visualizing differences in values across various categories at a glance.
Time series visualizations
Column Chart
The Column Chart provides a clear way to compare values across different categories. This visualization is particularly useful for displaying total values side by side. To ensure an effective display, the maximum number of categories allowed in the column chart is limited to 80.
- In the
X-axis, select the column you want to use for the categories. This column can be of any data type. - In the
Y-axis, select the column that contains the numeric values. This column must consist of numeric data.
Line Chart
The Line Chart is designed to visualize data points over a continuous range, making it ideal for displaying trends over time. To ensure clarity in the presentation, the maximum number of data points allowed in the line chart is limited to 200.
- In the
X-axis, select the column you want to use for the time or continuous variable. This column can be of any data type. - In the
Y-axis, select the column that contains the numeric values. This column must consist of numeric data.
Options
Breakdown by
The Breakdown By feature allows you to analyze your data in more depth across multiple visualization types, including Bar Charts, Column Charts, and Line Charts.
When you include a Group By clause in your query, you can break down your data by a specific attribute. This enables you to visualize how different categories or values contribute to the overall dataset.
Group mode
The Group Mode feature is available for Bar Charts and Column Charts, offering two display options: stacked and grouped.
- Stacked Mode: This mode stacks the values of each subgroup into a single bar, allowing you to see the total value for each category along with the contributions of each subgroup.
- Grouped Mode: In this mode, the bars for each subgroup are displayed side by side within each category, making it easier to compare the values between different subgroups.
Warning
Due to the important amount of logs ingested, the Query Builder has rate limits to protect the platform's health.
There are 3 rate limits:
- Maximum number of processed rows: At the moment the maximum value is 10 000.
- Maximum number of query: 10 query executions are allowed per minute.
- Query timeout: A query will timeout automatically after 10 minutes.
About the maximum number of processed rows limit, the Query Builder will display partial results in case this limit is reached.
Save your query
You can save your query to re-execute it later.
Choose a title for your query and click on the Save button.
Your last result is also saved and will be displayed when you open your saved query.
Note
- Saved queries are visible to all users of your community.
- In MSSP multi-tenancy, saved queries are not visible in sub-communities.
Export your results
You can export your results in JSON Lines format. Export file will have .jsonl extension.
JSON Lines is a convenient format for storing structured data that may be processed one record at a time. It works well with unix-style text processing tools and shell pipelines.
See JSON Lines documentation for more details.
Add query to dashboard
Queries can be added to dashboards. To read more about this feature, check our documentation on dashboards.
Share query from workspace to community
Individual queries created in a workspace can be shared with sub-communities to facilitate threat hunting and log analysis without sharing an entire dashboard.
- To start, create a new query or edit an existing one.
- Click Manage Access.
- Select the communities you want to share the query with.
- Click Save.
Note
Shared queries are available to users in the destination community in read-only mode.
Duplicate a shared query
If you want to edit a shared query, you must duplicate it. The original shared query remains in read-only mode, while the duplicated version is fully customizable.
- To find the query, navigate to the Queries page.
- Locate the shared query you wish to modify.
- Click the ... (three dots) icon associated with the query.
- Select Duplicate.
- Enter a name for the duplicated query and save your changes.