Telemetry
Overview
Have you ever found yourself curious about the frequency of an IP address appearing across your different communities? Or perhaps you've come across a mysterious domain name and wished for insights into its history within Sekoia.io's client base? Consider the advantage of cybersecurity experts having the ability to track the occurrences of threats across their clients' systems.
At the core of Sekoia.io's capabilities lies its telemetry feature, designed to assess the significance of data —whether it's a potential threat or contextual information— within the Sekoia.io ecosystem and across all its managed communities.
By harnessing the power of telemetry, SOC analysts can proactively validate indicators of compromise (IOCs) and gain a comprehensive grasp of the circumstances surrounding detection alerts. The telemetry empowers them to differentiate between global threats and more focused attacks, leveraging the insights provided by the platform's comprehensive data coverage.
This article delves into the nuances of threat and observable telemetry, explaining the distinction between the two. It also highlights where and how to access these features, while offering practical use cases that underscore their pivotal roles.
Telemetry of an observable
The Observable Telemetry feature within Sekoia.io provides a visual representation of observable instances and their frequency of appearance across monitored perimeters. The feature showcases the occurrence count of an observable, offering a valuable perspective on its presence within Sekoia.io's monitored environment.
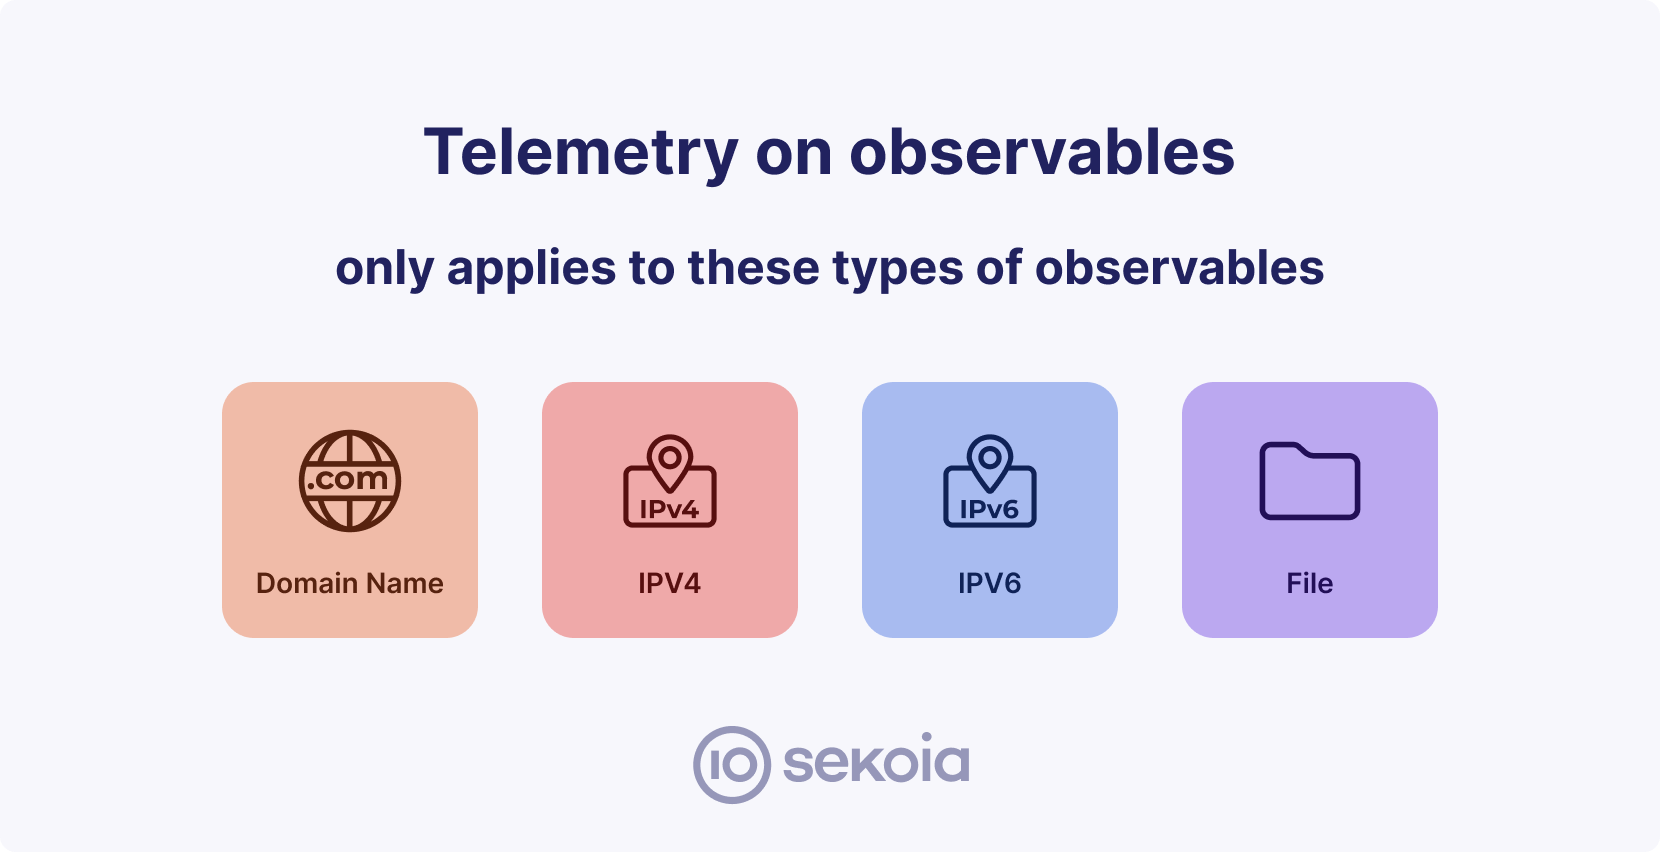
Telemetry on observables only concerns these types of observed data:
- Publicly addressable IPv4 Addresses
- Publicly addressable IPv6 Addresses
- Domain Names linked to Public Top-Level Domains (TLDs) such as .com, .gov.uk, .fr, and others.
- File Hashes
How it's computed
An observable telemetry is calculated based on the number of time the value of the observable has been parsed in events. These instances are what we call sightings inside the product and they can be found in various contexts.
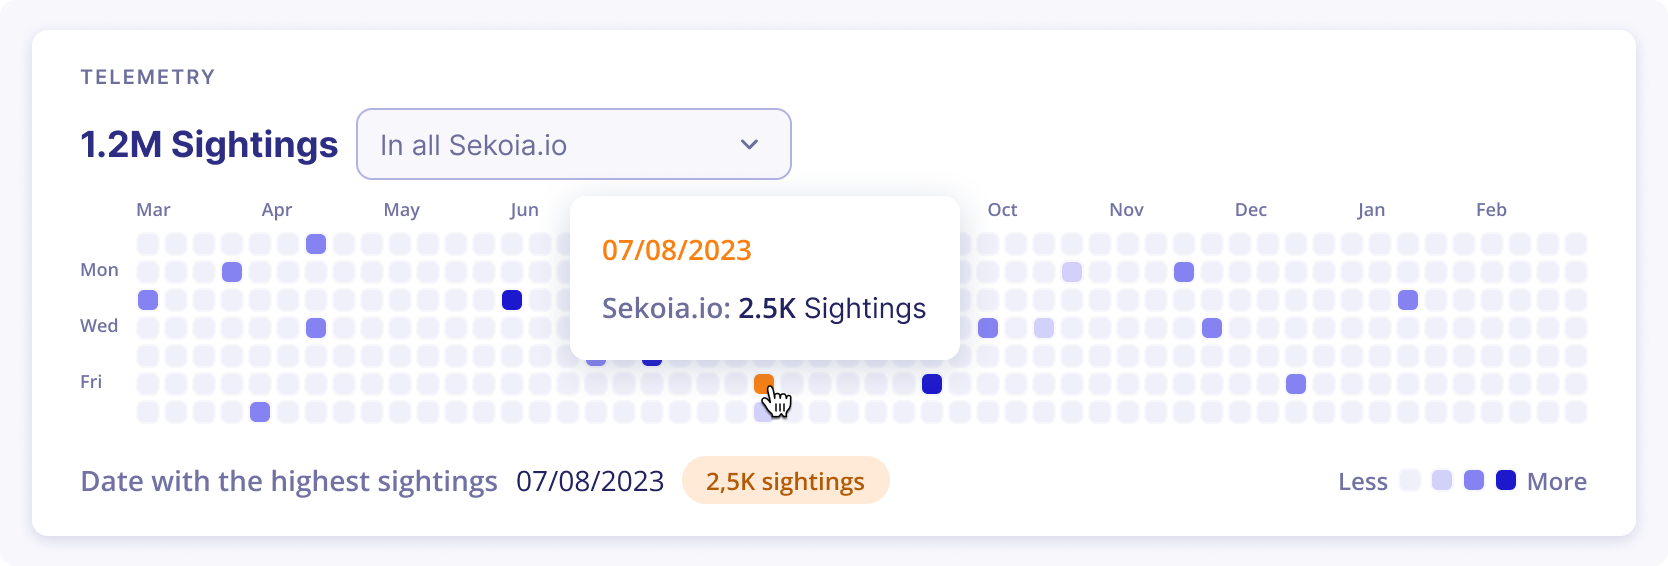
Telemetry heatmap
The telemetry data is presented in a daily breakdown over the past year, where each day is represented by a compact square box. The color intensity of the square box corresponds to the proportional number of observable sightings.
Available filters
The Observable Telemetry feature ensures flexibility for users to tailor their view based on their profile and permissions. This adaptability is particularly designed to accommodate Managed Security Service Providers (MSSPs) and various user scenarios.
For simple and multi-tenants communities, the following filters are available to show sightings by scope:
-
In all Sekoia.io: All users can access the telemetry of an observable across all Sekoia.io communities, offering a global comprehensive perspective of occurences.
-
In my managed communities: For MSSPs and multi-tenant communities, the system enables filtering of observable telemetry within the user's community and all its sub-communities. This feature facilitates robust monitoring across multiple interconnected entities.
-
Single-selected community: For MSSPs and multi-tenant communities, they can select a single community and access its telemetry.
How to access it
Intelligence database
The easiest way to access the telemetry of an observable is to follow these steps:
- Open the Intelligence database page
- Search for an observable and open the tab
Observables - Click on the observable in the table and access the Observable details page
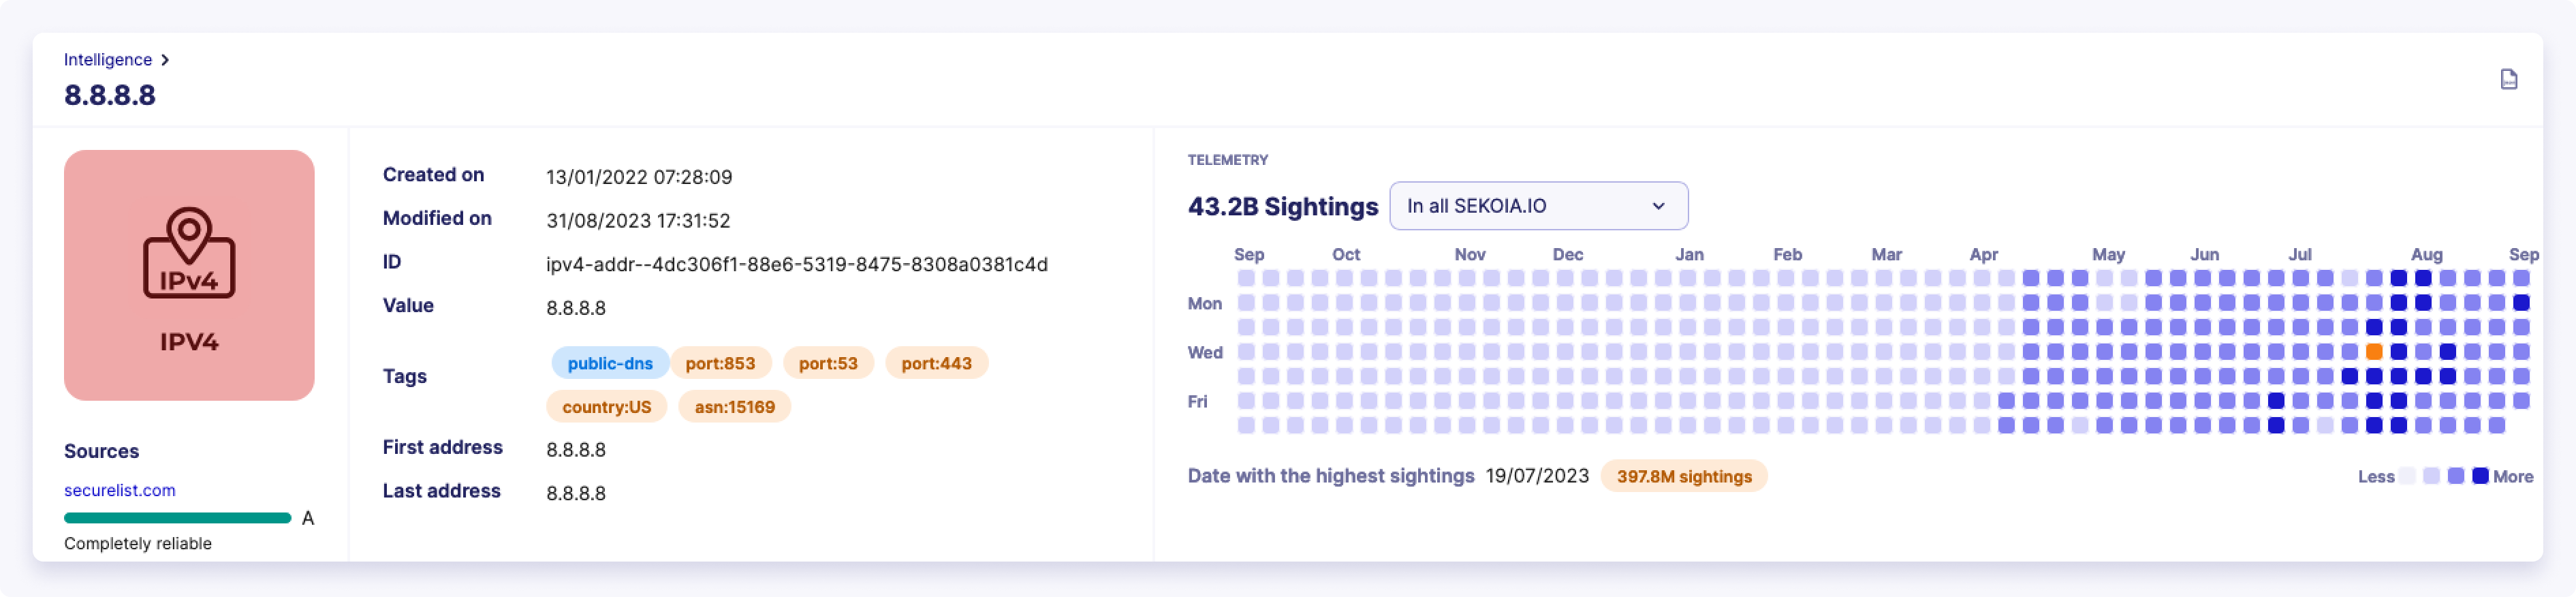
If your observable is an IPv4, IPv6, a domain name or a file hash, you should be able to access how many times this observable appeared in parsed events.
Alerts - Graph investigation
When a security alert is triggered, context is crucial to understand the urgency and potential impact of the threat. Telemetry visualization of the related observables can provide this context by showing the historical patterns and associations of the observable involved in the alert.
The telemetry visualization can display the past occurrences and fluctuations in the observable's sightings. By comparing the current sighting with historical data, security analysts can determine if the current alert is part of a larger pattern or an isolated incident, aiding in appropriate response decisions.
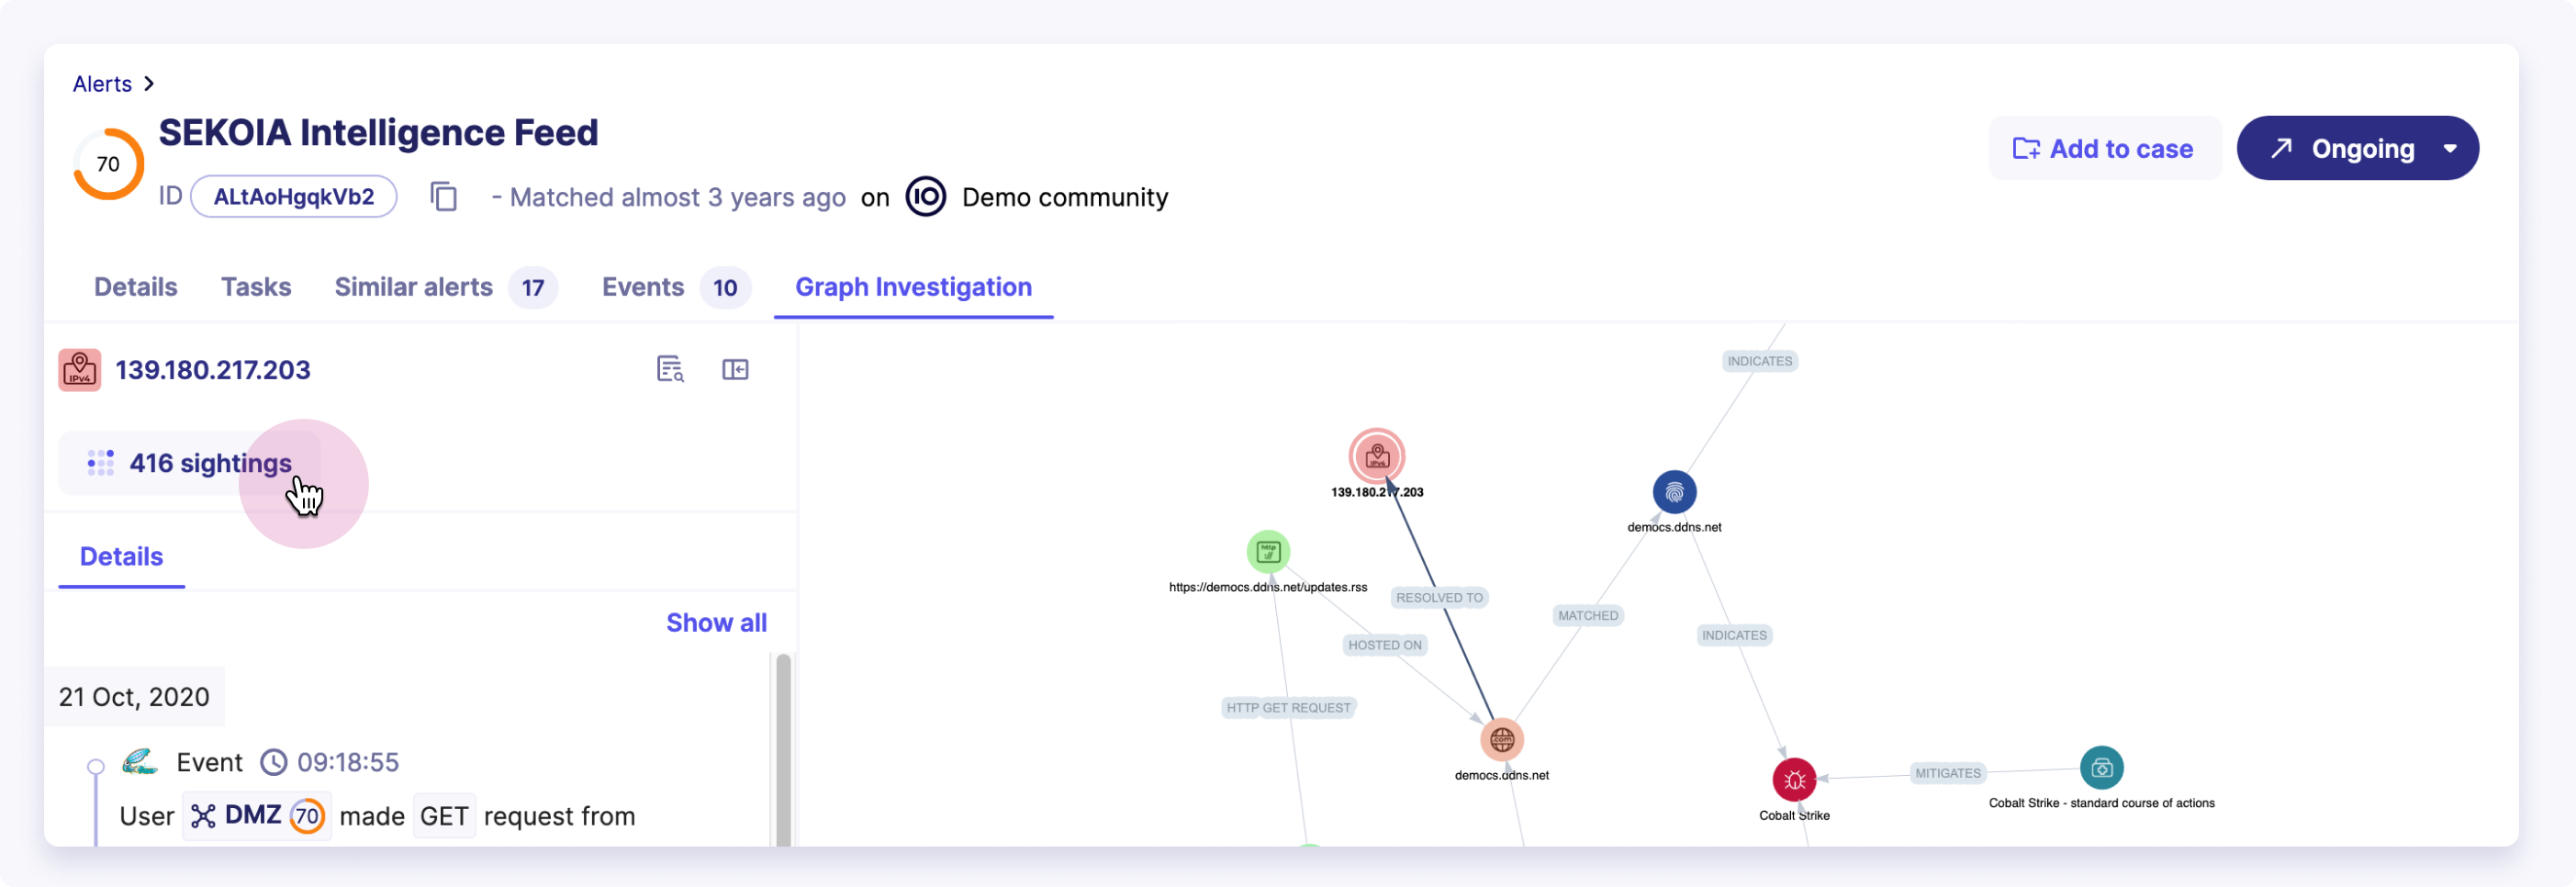
It is possible to see the telemetry of some observables in the graph by following these steps:
- Open an Alert details page
- Go to the
Graph Investigationtab - Click on an observable in the graph (public IPv4, public IPv6, domain names linked to public top-level domains, file hashes)
- In the left panel, a button with the number of sightings will appear
- Click on the button to access the full telemetry heatmap of the observable
Anteriority Check for Indicator of Compromise (IOCs)
Organizations often use observables as Indicators of Compromise (IOCs) to identify potential security threats. The telemetry visualization can serve as a crucial step in assessing the viability of an observable before using it as an IOC.
The telemetry data provides a valuable resource to scrutinize the observable's historical occurrences over time. By examining its consistent patterns of appearance, security experts can discern its reliability as an IOC. Contrary to what might be assumed, if the observable is continuously observed without significant deviations, it's less likely to be a reliable IOC.
In this case, the telemetry heatmap serves as a dynamic timeline, allowing security analysts to efficiently assess the observable's credibility.
Since you can import external IOCs to the platform by using the IOC collections feature, it's possible to generate a telemetry report to help verify the viability of the imported IOCs.
Warning
The generated telemetry report contains the associated observable telemetry, not the threat telemetry. This telemetry is calculated based on the occurence of a value, not a threat ID.
Telemetry of a threat
Sekoia.io employs telemetry visualization to track the occurrence patterns of various threat instances over time. Threats, in this context, encompass distinct categories of intelligence (STIX) objects.
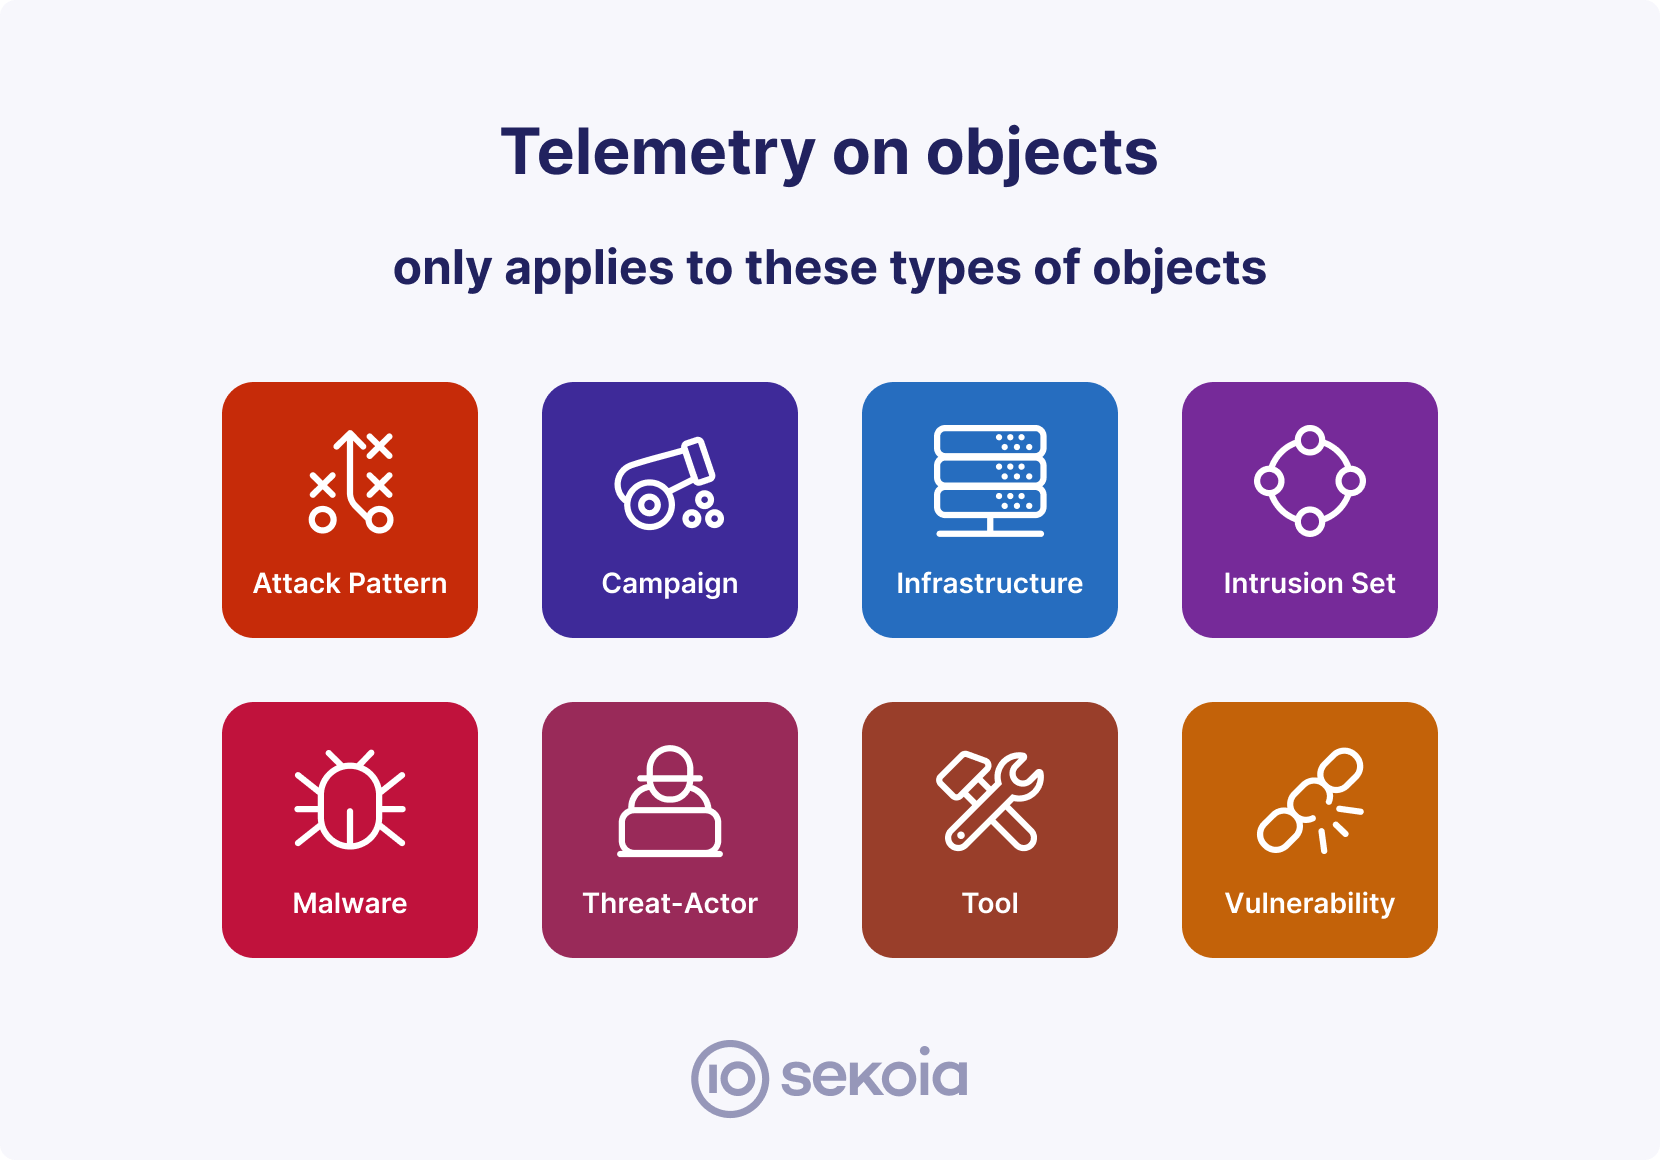
These are 8 types of objects we have telemetry on: Attack patterns, campaigns, infrastructures, intrusion sets, malware, threat actors, tools, vulnerabilities
How it's computed
A threat's occurrence is recorded whenever an alert is generated due to the detection materials associated with the threat. These detection materials can be Indicator of Compromises (IOCs), correlation rules, or AI models directly linked to the threat object.
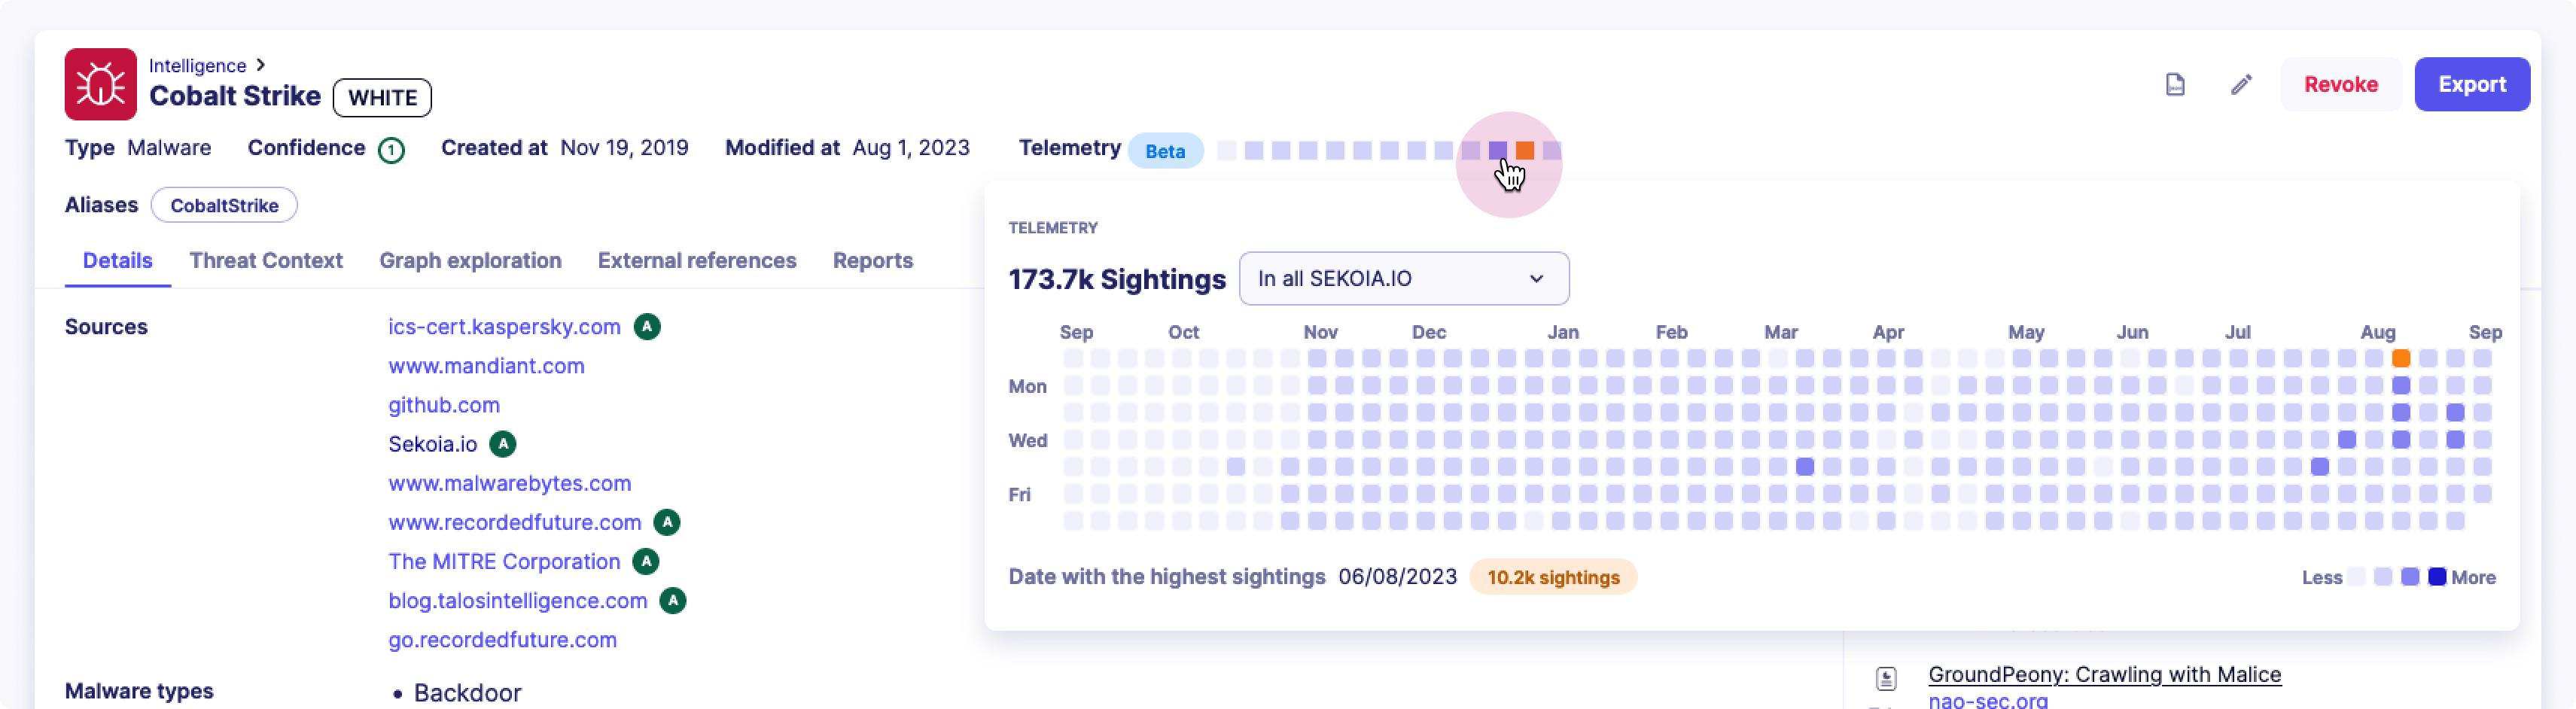
Telemetry heatmap
Telemetry is presented graphically in a heat map, illustrating the frequency of threat sightings on monitored perimeters. This visualization uses small square boxes that are color-coded based on the proportional count of sightings. These squares are organized along a timeline, representing days over the past year.
Available filters
The Observable Telemetry feature ensures flexibility for users to tailor their view based on their profile and permissions. This adaptability is particularly designed to accommodate Managed Security Service Providers (MSSPs) and various user scenarios.
For simple and multi-tenants communities, the following filters are available to show sightings by scope:
-
In all Sekoia.io: All users can access the telemetry of an observable across all Sekoia.io communities, offering a global comprehensive perspective of occurences.
-
In my managed communities: For MSSPs and multi-tenant communities, the system enables filtering of observable telemetry within the user's community and all its sub-communities. This feature facilitates robust monitoring across multiple interconnected entities.
-
Single-selected community: For MSSPs and multi-tenant communities, they can select a single community and access its telemetry.
How to access it
You can access the telemetry of a threat by following these guidelines:
- Open the Intelligence database page
- Search for a threat (Attack-patterns, campaigns, infrastructures, intrusion sets, malware, threat actors, tools and vulnerabilities) and click on it
- On the threat detailed page, the telemetry of the threat appears in the header
- The telemetry in the header of the object is a minimal version (each square represents a month). To access the full version of the heatmap, simply click on a square and it will show up.
Usecases
Assessing Threat Scope: Distinguishing Global vs. Targeted Threats
The Threat Telemetry feature in Sekoia.io serves as a pivotal tool for discerning the scope of a threat under investigation. One crucial use case involves the ability to determine whether a threat is widespread across various communities or if it's specifically targeted, only appearing within your community.
-
Global Threats: If a threat is detected across multiple communities within Sekoia.io, the Threat Telemetry visualization will reveal a consistent and widespread pattern of occurrences. The color-coded squares, representing threat sightings, will be noticeable beyond your community's data points. This indicates that the threat has a broader impact and could potentially necessitate collaborative responses in the context of an MSSP.
-
Targeted Threats: Conversely, if the threat's occurrences are confined solely to your community's data points in the Threat Telemetry visualization, it suggests a more targeted threat. This insight can guide investigations and response efforts more effectively. It may surely also impact the severity of the incident.
By providing a clear distinction between global and targeted threat occurrences, the Threat Telemetry feature empowers security professionals to make well-informed decisions and adopt appropriate strategies for threat mitigation and incident response.
Adaptive Cyber Stack Configuration: Prioritize the Strengthening of you Security Posture
An important use case of the Threat Telemetry feature lies in the ability to leverage threat telemetry insights to fine-tune your cyber stack configuration, aligning defenses with evolving threat landscapes. Threat Telemetry acts as a proactive informant for optimizing your cybersecurity arsenal, catering to the ever-changing threat landscape:
-
Identifying Emerging Threat Trends: By analyzing the Threat Telemetry data, security professionals can detect notable surges in specific threats, malware strains, or Tactics, Techniques, and Procedures (TTPs). Unusual spikes in sightings become indicators of evolving threat patterns that require attention.
-
Adaptive Configuration: Armed with this information, security teams can consider adapting their cyber stack configurations to counter the identified threats. This may involve fine-tuning existing detection mechanisms, enhancing monitoring for specific indicators, or even investing in new security technologies.
-
Precise Resource Allocation: Threat Telemetry helps organizations allocate resources judiciously. Instead of a blanket approach, security investments can be targeted towards addressing the most pertinent threats based on their recent escalation in sightings.
Incorporating insights from Threat Telemetry to adapt the configuration of your cyber stack support a real proactive cybersecurity strategy. It transforms the feature from a data source to a decision-enabling tool, empowering security professionals to fortify their defenses with precision, intelligence, and real-time relevance.