Microsoft IIS
Overview
- Vendor: Microsoft
- Supported environment: On Premise
- Version compatibility: 10.0 and newer
- Detection based on: Telemetry
- Supported application or feature: Application Logs Microsoft Internet Information Services (IIS) is a web server software for Windows, providing a secure and scalable platform for hosting and managing websites, applications, and services, widely used in enterprise environments.
Configuration
This setup guide will show you how to forward your Microsoft IIS logs to Sekoia.io by means of a syslog transport channel.
Create your intake
- Go to the intake page and create a new intake from the
Microsoft IIS. - Copy the associated Intake key
Activate log in Microsoft IIS
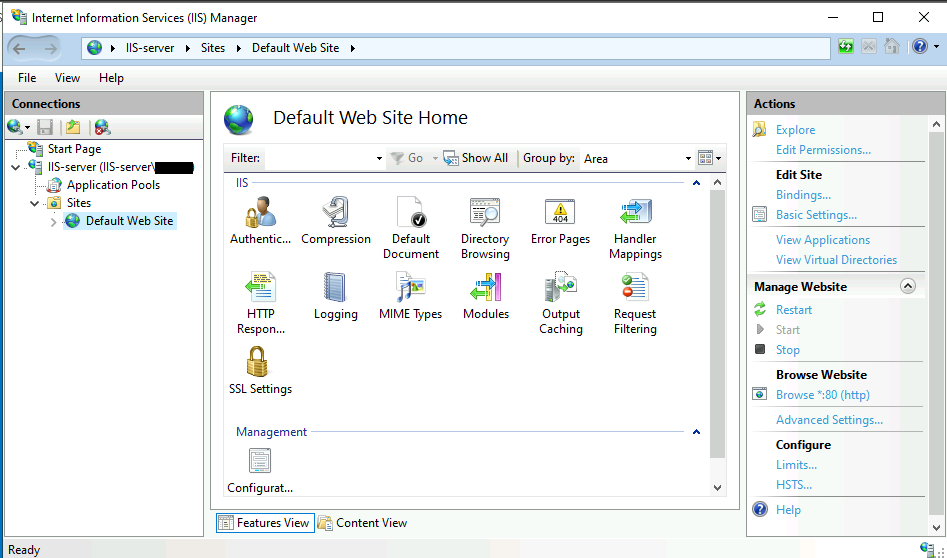
Launch the Internet Information Services (IIS) Manager
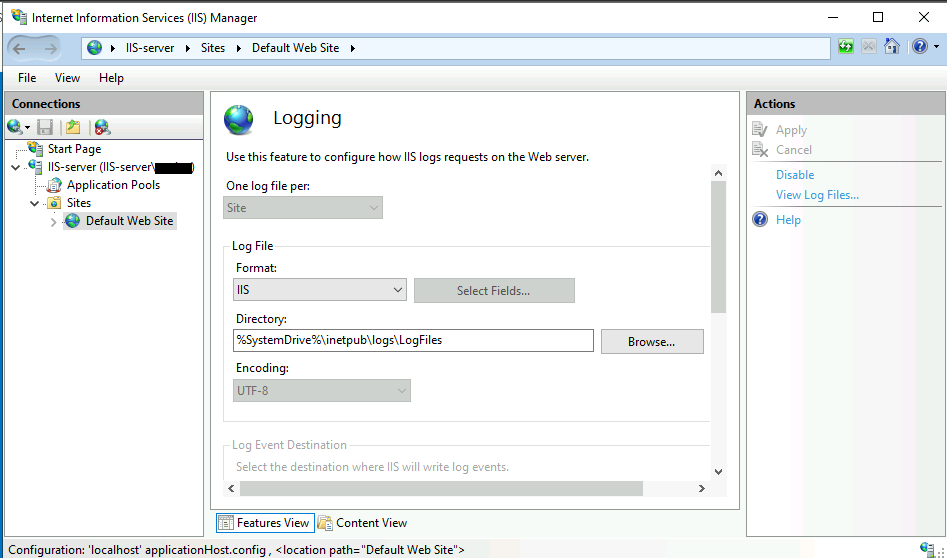
In the Connections panel, select the server then the desired site and go to the Logging section.

Select the format IIS and the encoding UTF-8 for the logs.

NXLog directly to Sekoia.io
This section describes how to configure NXLog to forward your Windows events by means of a syslog transport channel.
NXLog setup
To get started with NXLog, follow these steps:
- Download the NXLog installation package from the official website
- After the download is complete, proceed with the installation
- Navigate to the NXLog configuration file, which is located at
C:\\Program Files\\nxlog\\conf\\nxlog.conf - Update the configuration file with your intake key by following these instructions:
Note
Don't forget to replace YOUR_INTAKE_KEY variable with your actual intake key.
 ## This is a sample configuration file. See the nxlog reference manual about the configuration options.
 ## It should be installed locally and is also available online at <http://nxlog.org/nxlog-docs/en/nxlog-reference-manual.html>

 ## Please set the ROOT to the folder your nxlog was installed into,
 ## otherwise it will not start.

 #define ROOT C:\\Program Files (x86)\\nxlog
 define ROOT C:\\Program Files\\nxlog
 define CERTDIR %ROOT%\\cert

 Moduledir %ROOT%\\modules
 CacheDir %ROOT%\\data
 Pidfile %ROOT%\\data\\nxlog.pid
 SpoolDir %ROOT%\\data
 LogFile %ROOT%\\data\\nxlog.log

<Extension _syslog>
  Module xm_syslog
</Extension>

<Input iis>
  Module im_file
  File        'C:\inetpub\logs\LogFiles\W3SVC1\u_in*.log'
  SavePos  TRUE
</Input>

<Output sekoia_output>
  Module om_ssl
  Host intake.sekoia.io
  Port 10514
  CAFile %CERTDIR%\\Sekoia.io-intake.pem
  AllowUntrusted  FALSE

  Exec to_syslog_ietf();
  Exec $raw_event = replace($raw_event, '[NXLOG@', '[SEKOIA@53288 intake_key="YOUR_INTAKE_KEY"][NXLOG@', 1);
  OutputType Syslog_TLS
</Output>

<Route iis_to_sekoia_intake>
  Path iis => sekoia_output
</Route>
Download the certificate
To enable the connection between your events forwarder and the Sekoia.io intake, it is necessary to download the ISRG ROOT X1 certificate. Please follow these steps:
- Open a PowerShell console as an administrator.
-
Use the following command to retrieve the certificate and save it to the appropriate directory:
Invoke-WebRequest -Uri https://letsencrypt.org/certs/isrgrootx1.pem -OutFile 'C:\\Program Files\\nxlog\\cert\\isrgrootx1.pem' -
Restart the NXLog service through the Services tool as an administrator or use the following PowerShell command line as an administrator:
Restart-Service nxlog
After completing these steps, your events forwarder should be able to establish a secure connection with the Sekoia.io intake using the newly downloaded certificate.
NXLog to a concentrator
Configure NXLog
This section describes how to configure NXLog to forward your Windows events by means of a syslog transport channel to a concentrator.
To get started, follow these steps:
- Download the NXLog installation package from the official website
- After the download is complete, proceed with the installation
- Navigate to the NXLog configuration file, which is located at
C:\\Program Files\\nxlog\\conf\\nxlog.conf - Update the configuration file by following these instructions:
 ## This is a sample configuration file. See the nxlog reference manual about the
 ## configuration options. It should be installed locally and is also available
 ## online at <http://nxlog.org/nxlog-docs/en/nxlog-reference-manual.html>

 ## Please set the ROOT to the folder your nxlog was installed into,
 ## otherwise it will not start.

 #define ROOT C:\\Program Files\\nxlog
 define ROOT C:\\Program Files (x86)\\nxlog
 define CERTDIR %ROOT%\\cert

 Moduledir %ROOT%\\modules
 CacheDir %ROOT%\\data
 Pidfile %ROOT%\\data\\nxlog.pid
 SpoolDir %ROOT%\\data
 LogFile %ROOT%\\data\\nxlog.log

<Extension _syslog>
  Module xm_syslog
</Extension>

<Input iis>
  Module im_file
  File        'C:\inetpub\logs\LogFiles\W3SVC1\u_in*.log'
  SavePos  TRUE
</Input>

<Output rsyslog>
  Module om_tcp
  Host RSYSLOG_HOST
  Port 514
  OutputType Syslog_TLS

  Exec to_syslog_ietf();
</Output>
<Route iis_to_rsyslog>
  Path iis => rsyslog
</Route>
Info
To ensure proper configuration, it is important to replace the RSYSLOG_HOST variable with the IP address of your concentrator.
Warning
OutputType Syslog_TLS is needed for TCP transport even if you do not encrypt data. It does not depend on SSL transport at all.
Remove it ONLY if you use UDP - om_udp.
For more information, consult NXLog documentation.
Note
The iso8859-1 character encoding is limited to 256 characters, which is not enough to represent all French characters. This means that some French characters might not be correctly interpreted or displayed when using iso8859-1 encoding. For example, iso8859-1 does not include characters such as é, è, ê, and ë. In order to correctly represent these characters, it is recommended to install the Sekoia.io agent. This endpoint agent is specifically designed to handle such issues, ensuring the accurate and secure transmission of data.
Restart the NXLog service through the Services tool as Administrator or use this Powershell command line as admin:
Restart-Service nxlog
Configure the concentrator to forward events to Sekoia.io
Please read the dedicated documentation for each concentrator:
Note
While Sekoia.io docker concentrator is highly recommended, you are free to use the one that you are most comfortable with.
Raw Events Samples
In this section, you will find examples of raw logs as generated natively by the source. These examples are provided to help integrators understand the data format before ingestion into Sekoia.io. It is crucial for setting up the correct parsing stages and ensuring that all relevant information is captured.
::1, -, 11/20/2023, 15:44:03, W3SVC1, IIS-server, ::1, 2, 769, 143, 304, 0, GET, /, -,
Detection section
The following section provides information for those who wish to learn more about the detection capabilities enabled by collecting this intake. It includes details about the built-in rule catalog, event categories, and ECS fields extracted from raw events. This is essential for users aiming to create custom detection rules, perform hunting activities, or pivot in the events page.
Related Built-in Rules
The following Sekoia.io built-in rules match the intake Microsoft IIS. This documentation is updated automatically and is based solely on the fields used by the intake which are checked against our rules. This means that some rules will be listed but might not be relevant with the intake.
SEKOIA.IO x Microsoft IIS on ATT&CK Navigator
Cryptomining
Detection of domain names potentially related to cryptomining activities.
- Effort: master
Discord Suspicious Download
Discord is a messaging application. It allows users to create their own communities to share messages and attachments. Those attachments have little to no overview and can be downloaded by almost anyone, which has been abused by attackers to host malicious payloads.
- Effort: advanced
Dynamic DNS Contacted
Detect communication with dynamic dns domain. This kind of domain is often used by attackers. This rule can trigger false positive in non-controlled environment because dynamic dns is not always malicious.
- Effort: master
Exfiltration Domain
Detects traffic toward a domain flagged as a possible exfiltration vector.
- Effort: master
Koadic MSHTML Command
Detects Koadic payload using MSHTML module
- Effort: intermediate
Potential Azure AD Phishing Page (Adversary-in-the-Middle)
Detects an HTTP request to an URL typical of the Azure AD authentication flow, but towards a domain that is not one the legitimate Microsoft domains used for Azure AD authentication.
- Effort: intermediate
Remote Access Tool Domain
Detects traffic toward a domain flagged as a Remote Administration Tool (RAT).
- Effort: master
Sekoia.io EICAR Detection
Detects observables in Sekoia.io CTI tagged as EICAR, which are fake samples meant to test detection.
- Effort: master
TOR Usage Generic Rule
Detects TOR usage globally, whether the IP is a destination or source. TOR is short for The Onion Router, and it gets its name from how it works. TOR intercepts the network traffic from one or more apps on user’s computer, usually the user web browser, and shuffles it through a number of randomly-chosen computers before passing it on to its destination. This disguises user location, and makes it harder for servers to pick him/her out on repeat visits, or to tie together separate visits to different sites, this making tracking and surveillance more difficult. Before a network packet starts its journey, user’s computer chooses a random list of relays and repeatedly encrypts the data in multiple layers, like an onion. Each relay knows only enough to strip off the outermost layer of encryption, before passing what’s left on to the next relay in the list.
- Effort: master
Event Categories
The following table lists the data source offered by this integration.
| Data Source | Description |
|---|---|
Web logs |
Microsoft IIS logs site activity |
In details, the following table denotes the type of events produced by this integration.
| Name | Values |
|---|---|
| Kind | `` |
| Category | web |
| Type | access |
Transformed Events Samples after Ingestion
This section demonstrates how the raw logs will be transformed by our parsers. It shows the extracted fields that will be available for use in the built-in detection rules and hunting activities in the events page. Understanding these transformations is essential for analysts to create effective detection mechanisms with custom detection rules and to leverage the full potential of the collected data.
{
    "message": "::1, -, 11/20/2023, 15:44:03, W3SVC1, IIS-server, ::1, 2, 769, 143, 304, 0, GET, /, -,",
    "event": {
        "category": [
            "web"
        ],
        "duration": 2000,
        "type": [
            "access"
        ]
    },
    "@timestamp": "2023-11-20T15:44:03Z",
    "client": {
        "address": "::1",
        "bytes": 769,
        "ip": "::1"
    },
    "http": {
        "request": {
            "method": "GET"
        },
        "response": {
            "status_code": 304
        }
    },
    "observer": {
        "name": "IIS-server"
    },
    "related": {
        "ip": [
            "::1"
        ]
    },
    "server": {
        "bytes": 143,
        "ip": "::1"
    },
    "url": {
        "path": "/"
    }
}
Extracted Fields
The following table lists the fields that are extracted, normalized under the ECS format, analyzed and indexed by the parser. It should be noted that infered fields are not listed.
| Name | Type | Description |
|---|---|---|
@timestamp |
date |
Date/time when the event originated. |
client.bytes |
long |
Bytes sent from the client to the server. |
client.ip |
ip |
IP address of the client. |
event.category |
keyword |
Event category. The second categorization field in the hierarchy. |
event.duration |
long |
Duration of the event in nanoseconds. |
event.type |
keyword |
Event type. The third categorization field in the hierarchy. |
http.request.method |
keyword |
HTTP request method. |
http.response.status_code |
long |
HTTP response status code. |
observer.name |
keyword |
Custom name of the observer. |
server.bytes |
long |
Bytes sent from the server to the client. |
server.ip |
ip |
IP address of the server. |
url.path |
wildcard |
Path of the request, such as "/search". |
user.name |
keyword |
Short name or login of the user. |
For more information on the Intake Format, please find the code of the Parser, Smart Descriptions, and Supported Events here.