Events
The events page provides a centralized view of your events and enables in depth investigation in the latest logs sent to Sekoia.io. With its query-based search bar, the possibility to easily add and remove filters and its new aggregation tool, this page lets you sort, filter, analyze and visualize logs in an efficient manner.
In this documentation, we will dive into the different parts that constitute the Events page:
- The Search bar and its filtering and sharing options
- The list of events and the detailed view of your parsed events
- The mechanism behind events enrichment or how events are contextualized in Sekoia.io
- The aggregation feature and how to create an anomaly detection rule from your query
Note
To send your logs to Sekoia.io, please refer to this section.
Search bar
You can search among the list of events by using the dedicated query language. A complete documentation on how to use this language is available here.
Fields you can use to narrow down your events search are listed here.
Filters
It is possible to further restrict the scope of your events search by using filters. Filters are combined together and with the search query with a logical AND.
You can easily add filters by using the icon buttons provided when hovering over a value inside a Smart Description or an event's Details:
- Use the
Filter for valuebutton to only see events with this value - Use the
Filter out valuebutton to only see events that DO NOT have this value
You can also add filters manually by clicking on the "Add Filter" icon below the Search Bar. The following filter operators are available when creating filters manually:
| Operator | Description |
|---|---|
= |
The field must exactly match the value. |
exists |
The field must exist. |
starts with |
The field must start with the value. Only for text fields |
ends with |
The field must end with the value. Only for text fields |
contains |
The field must contain the value. Only for text fields |
> |
The field must be greater than the specified number. Only for numerical fields |
>= |
The field must be greater than or equal to the specified number. Only for numerical fields |
< |
The field must be less than the specified number. Only for numerical fields |
<= |
The field must be less than or equal to the specified number. Only for numerical fields |
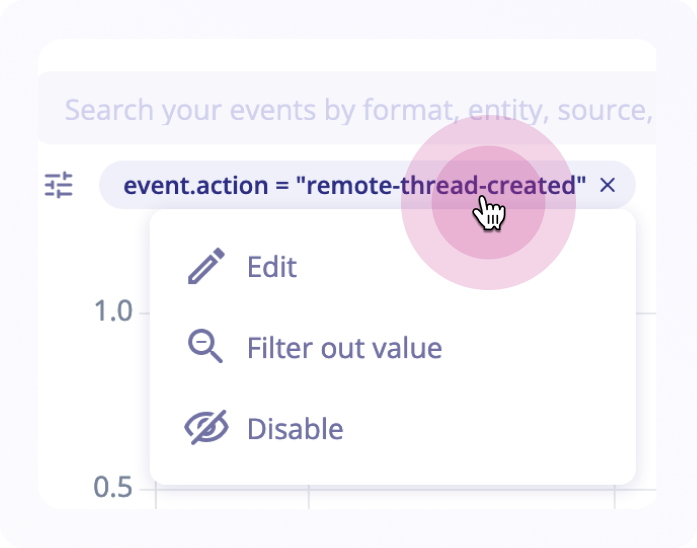
Each filter is added as a badge below the Search Bar. A filter can be removed by clicking on the X at the end of the badge. You can also click on a filter to access a menu that will allow you to:
- Edit the filter
- Invert the filter (filtering out instead of filtering for, or vice versa)
- Temporarily disable or re-enable a filter
To clear current filters, you can use the Clear all button at the end of the filters.
Save search query
It is possible to save a query by clicking the Star icon in the search bar. The selected period of time is not saved with it.
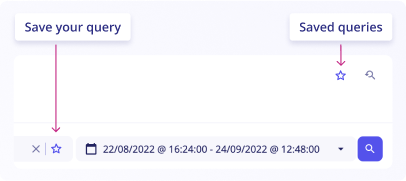
To access your saved queries:
- Click on
Saved queries(the star button in the top right of the page) - Select a period of time
-
Click on
Searchto see your saved query eventsDisclaimer
The saved queries are stored locally on the user's browser. Ensure that you do not have a task or setting that cleans your browser cookies, as this will result in the loss of your favorite queries.
Date
It is possible to select the period of time to be taken into consideration when using a filter. You can use:
Presets: Recommended predefined datesDate relatives: Select earliest and latest momentsDate ranges: Gap between two dates
Click on the Apply button to start your search based on these filters.
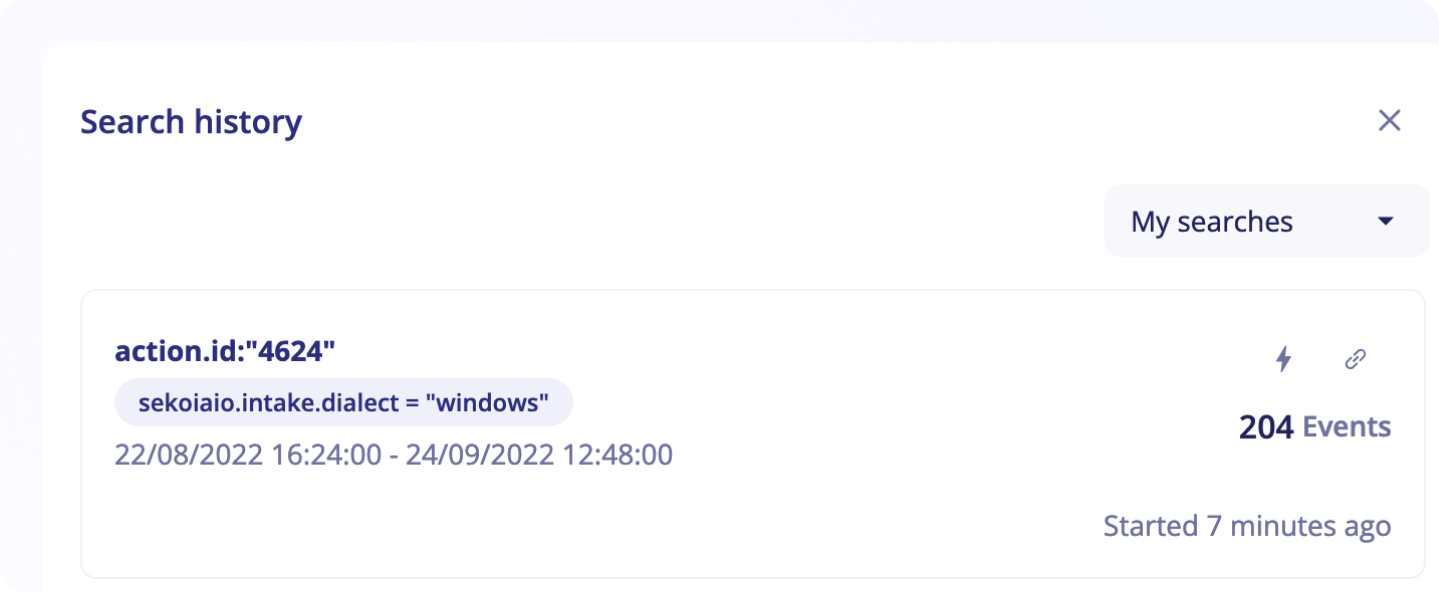
Search history
Each events search performed is listed in the Search History for 30 days. You can use the search history to easily access past search results.
It is accessible by clicking on the following button (a panel will be displayed with the previous searches)

When you are creating a new search, results are available instantly for 30 minutes by default.
It is possible to configure the retention to reach up to one day (24 hours). After this retention period, you can still replay any events search available in the Search History by simply clicking on it. It will trigger a new search using exactly the same parameters (query, filters and date range).
By default, the Search History panel is only listing your events search. You can access all events search by clicking on My Searches at the top of the panel and selecting All Searches.
Sharing a search
Search Results can be shared with your colleagues by sending them the unique search URL. All users that have access to your community can use this URL to access your search results.
To obtain the search URL, you can:
- Click on the
Share / Linkicon inside theSearch Historypanel - Copy the active URL from the browser address bar
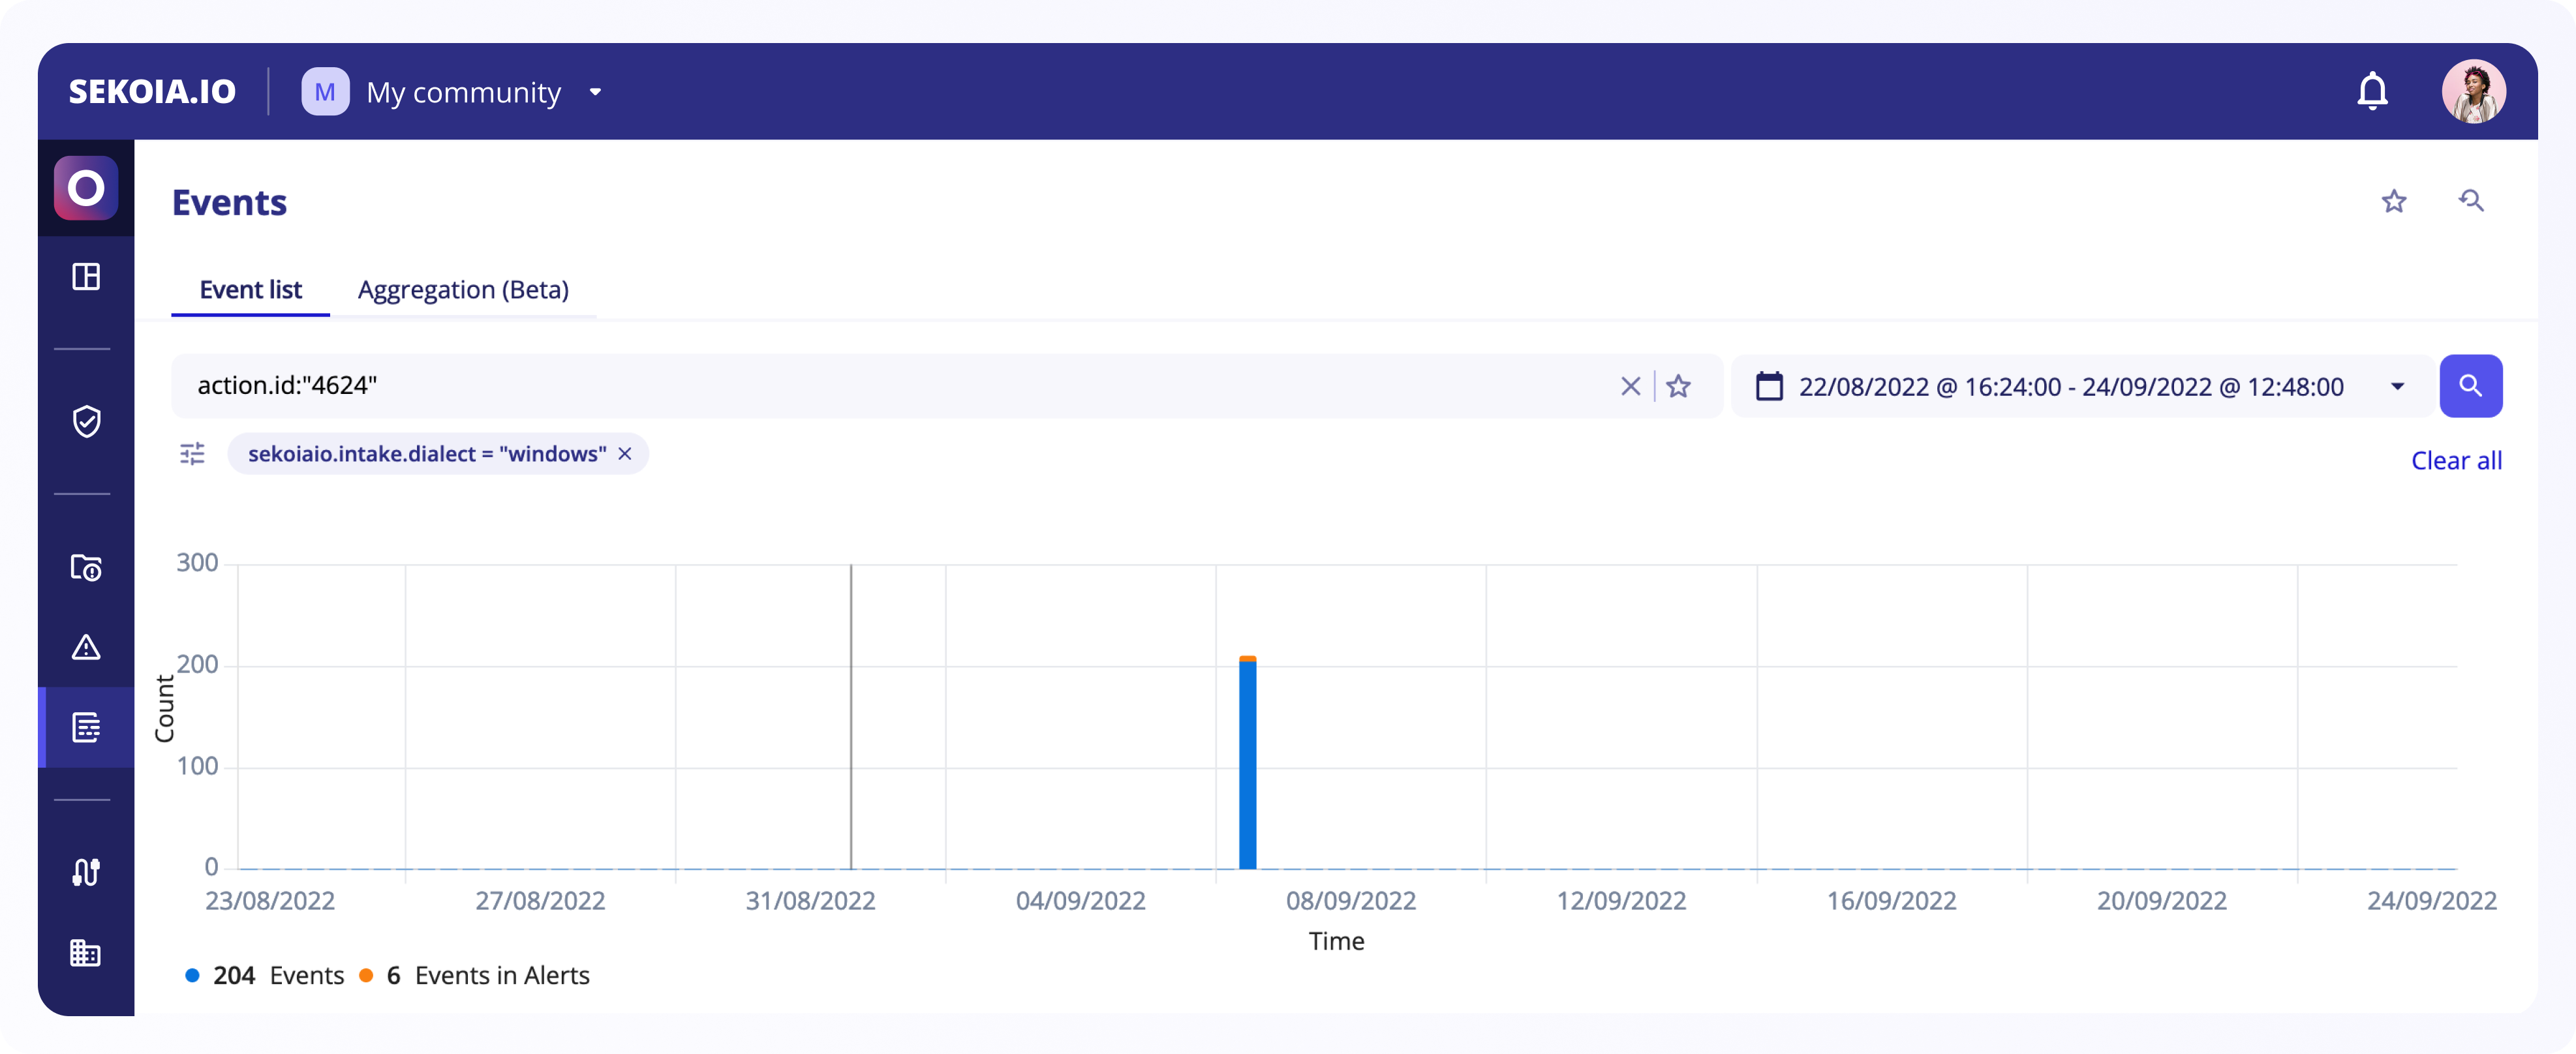
Histogram
Events histogram appears under the search bar when a query has been made and matches events in the list.
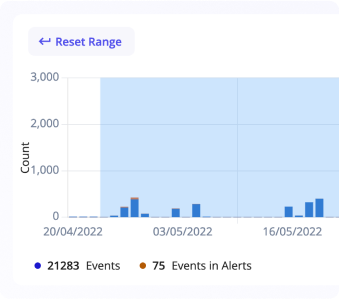
It gives a consolidated view of all matching events in a specific period of time and it highlights the number of events as well as events that are present in alerts.
You can select a date range by clicking on the histogram and dragging the cursor over events you are interested in. This will automatically create a new search and display filtered results. If you want to come back to the previous range, you can use the search history
Log listing
The columns by default are:
Timestamp: Event dateEvent.dialect: Type of intake that sent the eventDescription: Smart description with clickable links formatted by Sekoia.io to show the most important elements and make them easily accessible, such as IP address, type or entity
Note
At most 1 000 events can be displayed in the table. If this number is reached, the search has to be narrowed.
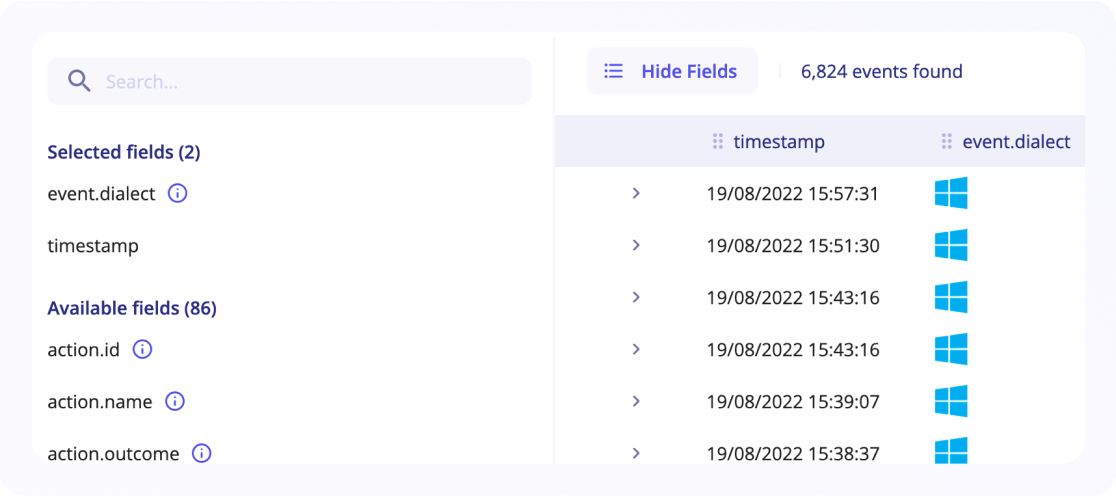
Show and hide columns
It's possible to show or hide columns in your events table by clicking on the Show fields & top values button.
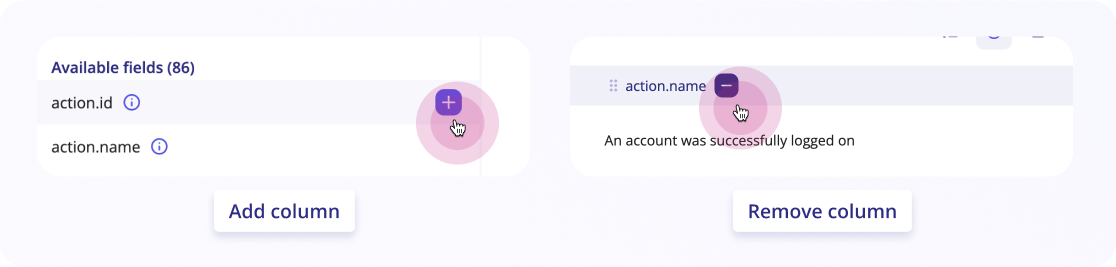
Once open, you can add fields that are listed under available fields by simply clicking on the "+" button next to them. This will automatically add the column to your table.
If you need to remove a column, there are two ways to do so:
-
Hover on the column and a "-" will appear. Click on it and the column will be hidden
-
Click on
Show fields & top valuesand hover your mouse on theSelected fieldsthat you want to hide. Click the "-" that appears and they'll be hidden
You can always find these fields in the Available fields section.
Tip
You can also change the order of your columns by dragging them using the icon next to the column's name.
Log lines
Each line of log can be unrolled to show:
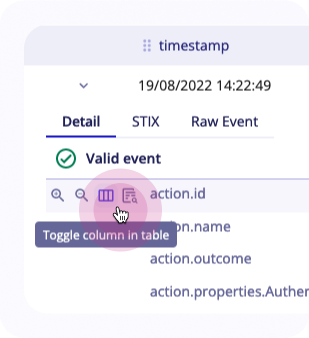
STIX: Event as a STIX bundle that will be used by detection enginesRaw event: Event as received by Sekoia.ioDetail: Detailed information retrieved from the log after parsing with elements from the event related to the intake and the community.
This table explains the main actions that can be done for each of these fields:
| Action | Description |
|---|---|
| Filter for value | Adds field in the query |
| Filter out value | Removes field in the query |
| Toggle column in table | Adds field as a column in the table |
| Search events with this value | Opens right panel to search field in all events |
| Copy | Copy value of the field |
Adding events to cases
When searching through your event logs, you will often find events valuable to your current investigation. You can add these events to a case to keep track of them and use them as potential pivots.
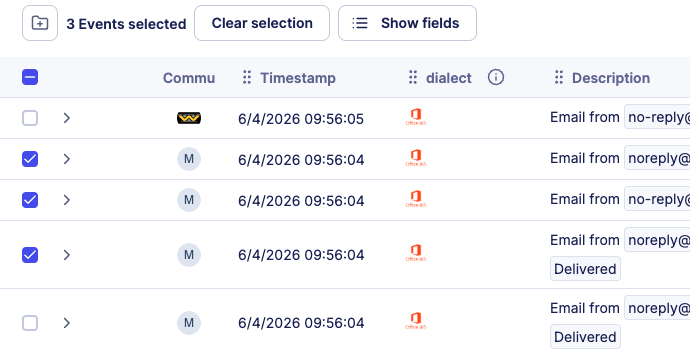
You can add several events to a case at once:
- Select the events you want to add using the checkboxes on the left of each event line. A counter shows how many events are selected. You can also select every event on the current page by clicking the checkbox in the table header.
- Click the
Add to casebutton. - In the modal that opens, you can:
- Select an existing case from the list
- Search for an existing case by name
- Create a new case
Note
A maximum of 1 000 events can be added to a case in a single operation.
Note
Events selected from different communities cannot be added together. In that case, the Add to case button is disabled and a tooltip explains the reason.
Export the results of a search
You can easily export the results of a search in CSV or JSON format and choose the fields you want to export.
To do so:
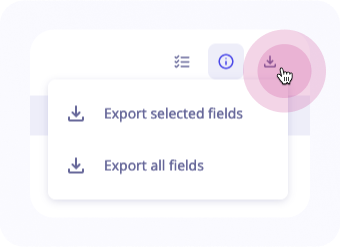
- Click on the button
Export eventson the upper right of the logs' table - Either export all fields or only a selection of fields
When you export all fields, even the fields that don't have a value will be exported in a table.
The export will be made to the default folder defined for downloads. Name of the file is optional, if not provided, the file will be named with the UUID of the job search.
Note
The description field will not be exported.
Note
At most 1 000 events can be exported if a filter or query is specified. Otherwise only 500 events will be exported. If this number is reached, the search has to be narrowed.
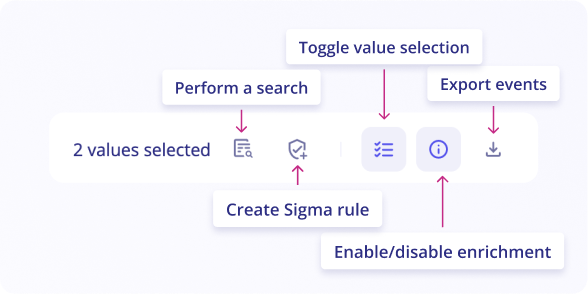
Toggle value selection
You can toggle values in your logs by clicking on the button Toggle value selection in the upper right side of the logs table.
Go through your events and click on values of interest. All similar values will be selected and highlighted in the events list.
Once you’ve selected these values, you can either perform a search on these values OR create a Sigma Rule with a pattern based on selected values.
Events enrichment
Event enrichment consists of adding contextualization data to the standardized event. The objective is to increase the reliability of detection and qualification.
Two sources are used by Sekoia.io XDR to systematically enrich each event: Observables and Assets.
The first source gathers all the technical artefacts, also called observables, collected by Sekoia.io analysts during their investigations. Consisting of tens of millions of objects, this database allows us to provide legitimate and/or malicious context to each event. For example, observables are used to geolocate public IP addresses and recognize all legitimate binaries according to Microsoft Windows.
The second source of enrichment relies on a configuration management database (i.e. assets) to provide organization-specific context. The user is invited to consolidate a list of key resources such as brands, users, applications, or hardware present in the organisation. These assets are used continuously to contextualize events with information from the associated resources. This contextualization greatly increases the effectiveness of qualification.
For example, this enrichment allows you to identify the nature of the legitimate actions expected on an office workstation associated with a specific team in your community.
You can enable or disable enrichment in logs by clicking on the enable/disable enrichment in the upper right of the logs table.
Depending on your entities, assets and other data, you’ll be able to make sense of your events more efficiently.
To see the value of enriched values, click on the enriched field and you'll be provided with additional context.
Note
If the value exists in the Intelligence Center, tags associated with the value in question will be added as additional context.
Aggregation
Aggregation is a new (beta) feature on Sekoia.io!
By using line charts, you can now visualize change in your logs over a continuous range. Visualizing change with a line chart allows the overall trend to be displayed at once, and multiple trends to be compared simultaneously. This new view on the events page can be useful to visualize events during a hunting phase or incident response.
The aggregation-based hunting feature is often the first step in the journey path taken by the user to create an anomaly detection rule.
Users can now compute aggregations on the results of any search query in the events list. The aggregated values will be displayed over time, depending on the date range chosen.
To compute aggregations on a list of events, you’ll have to:
- Search in your log list by following this documentation
- Open the new tab
Aggregation (Beta)that is accessible on the upper left of the page - Select an aggregation method from the list
- Select an aggregation field if needed
- Click on the
Searchbutton on the upper right of the page
Note
Aggregation view feature does not support the field alert_short_ids.
Aggregation methods
Average(only for numerical data): aggregate average of field values per bucketCardinality(only for string data): count cardinality of values per bucketCount: count events per bucket (for a specific filter or field set to a value)Min(only for numerical data): aggregate min of field values per bucketMax(only for numerical data): aggregate max of field values per bucketSum(only for numerical data): aggregate sum of field values per bucket
Aggregation graph
Depending on which methods and fields have been selected, a line graph is presented with the event values on the y-axis and the date as defined by the date range on the x-axis.
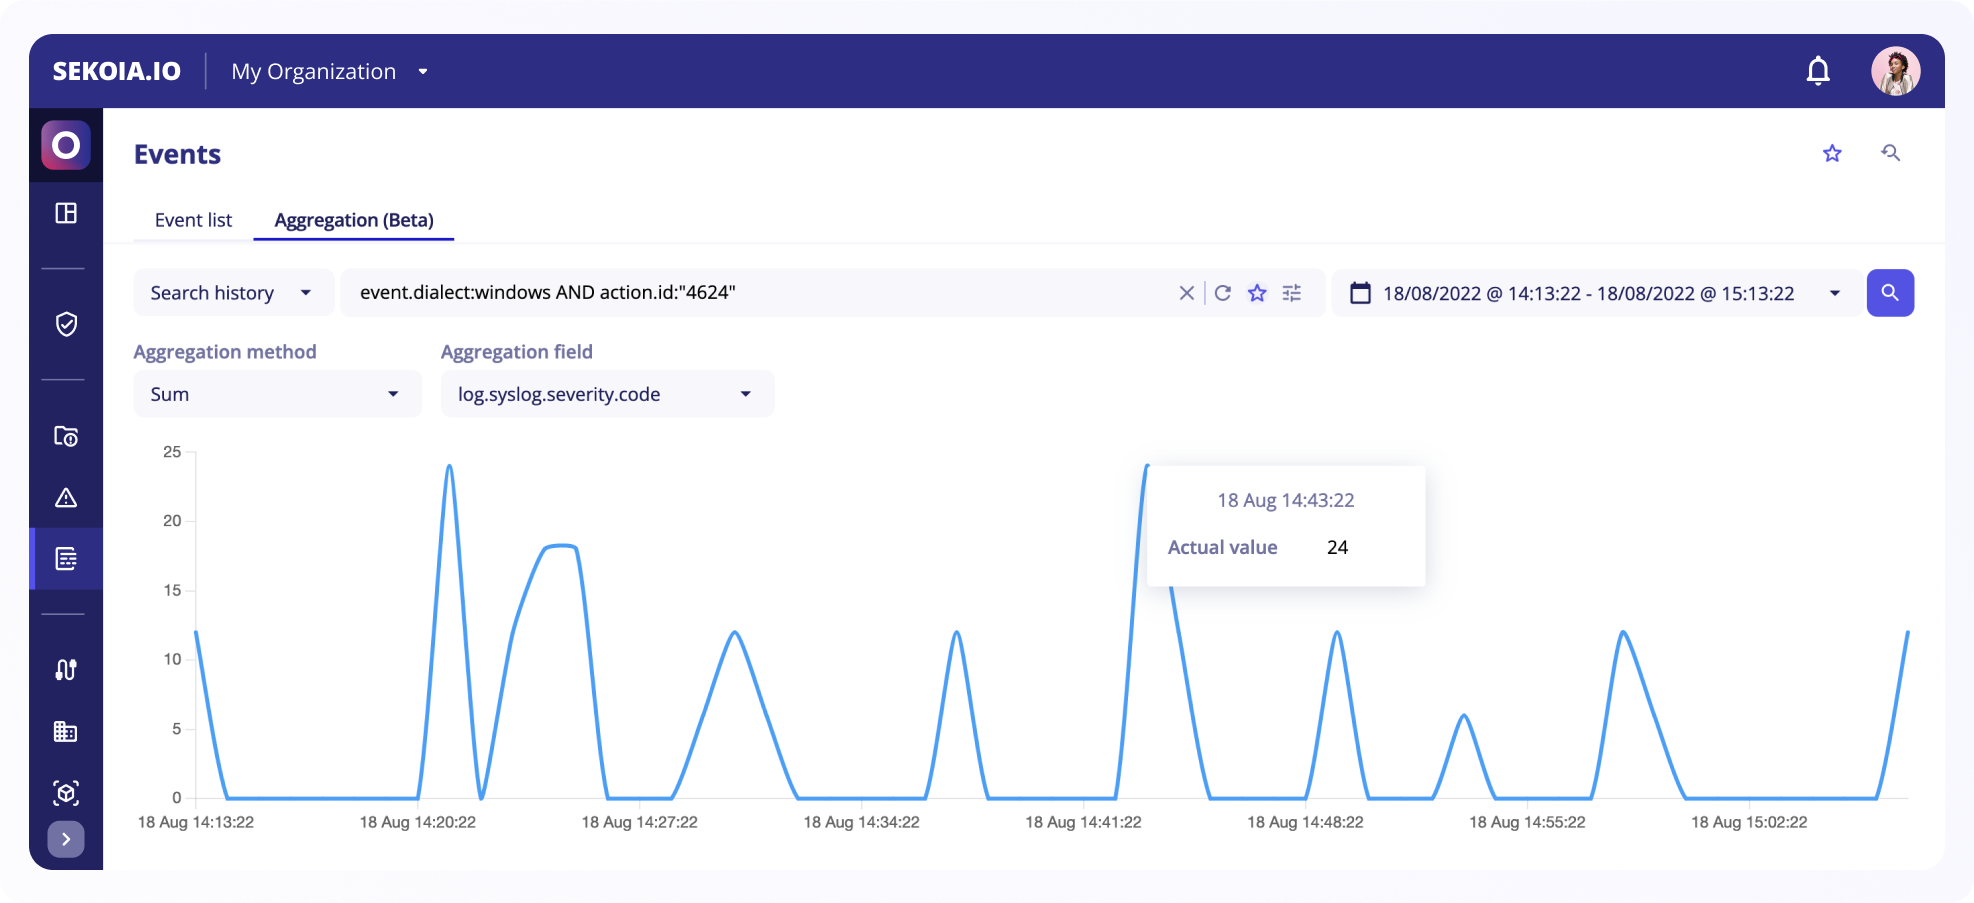
For each aggregate the chart displays the first value, last value, minimum, and maximum sorted by timestamp and connects them by one line per variable.
You can hover on the line graph to see the actual value of each point as well as the exact date of the point.
Create Anomaly Detection rule from the aggregation view
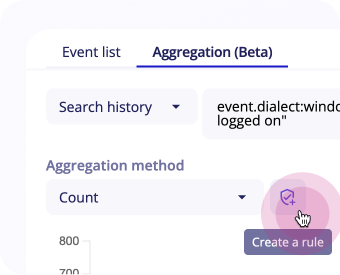
You can create anomaly detection rules directly from this view.
If you select count as aggregation method, a Create new rule button shows up next to the fields and the Rule Creation panel opens up with detection patterns automatically set to Anomaly, and with your events’ query and the chosen aggregation method.
Learn more about Anomaly Detection rules in this section.