Navigate playbooks' interface
Playbooks listing
In the playbooks’ homepage are listed all playbooks created within your community. These playbooks are listed by order of last edited and there are multiple filters made available to navigate this page with ease.
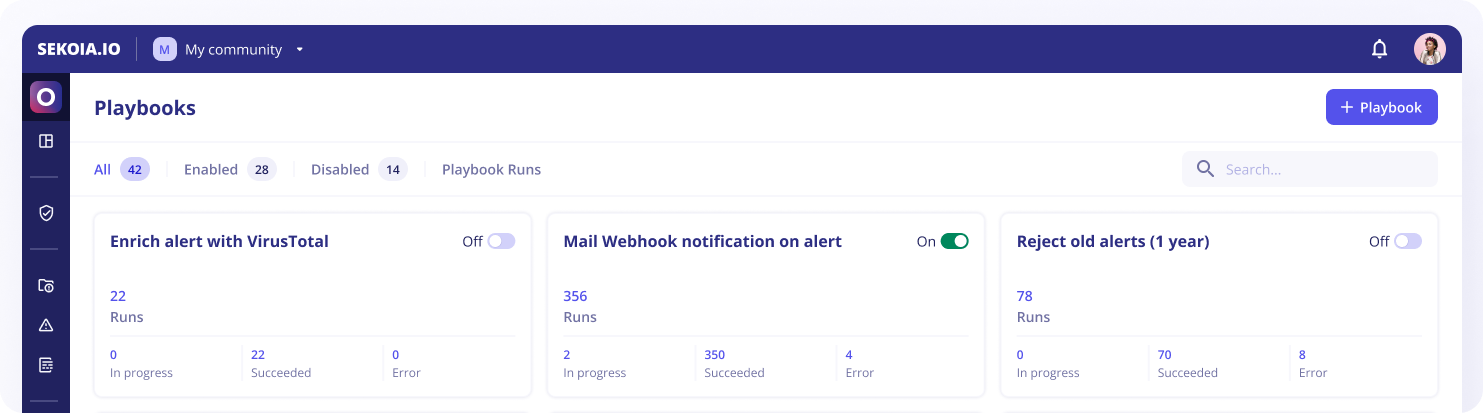
From this page, you can:
- Create a new
playbookormeta-playbook(impacting multiple communities) - Search for available playbooks
- Filter available playbooks by Activation (enabled/disabled)
- Delete a playbook
- Access to playbook runs by status:
all,in progress,errorandsucceeded - Review playbook statuses :
ready to start,configuration issues,partially activated,failed runs,trigger crashed. Status tags also allowed to access to its details directly
Playbook details
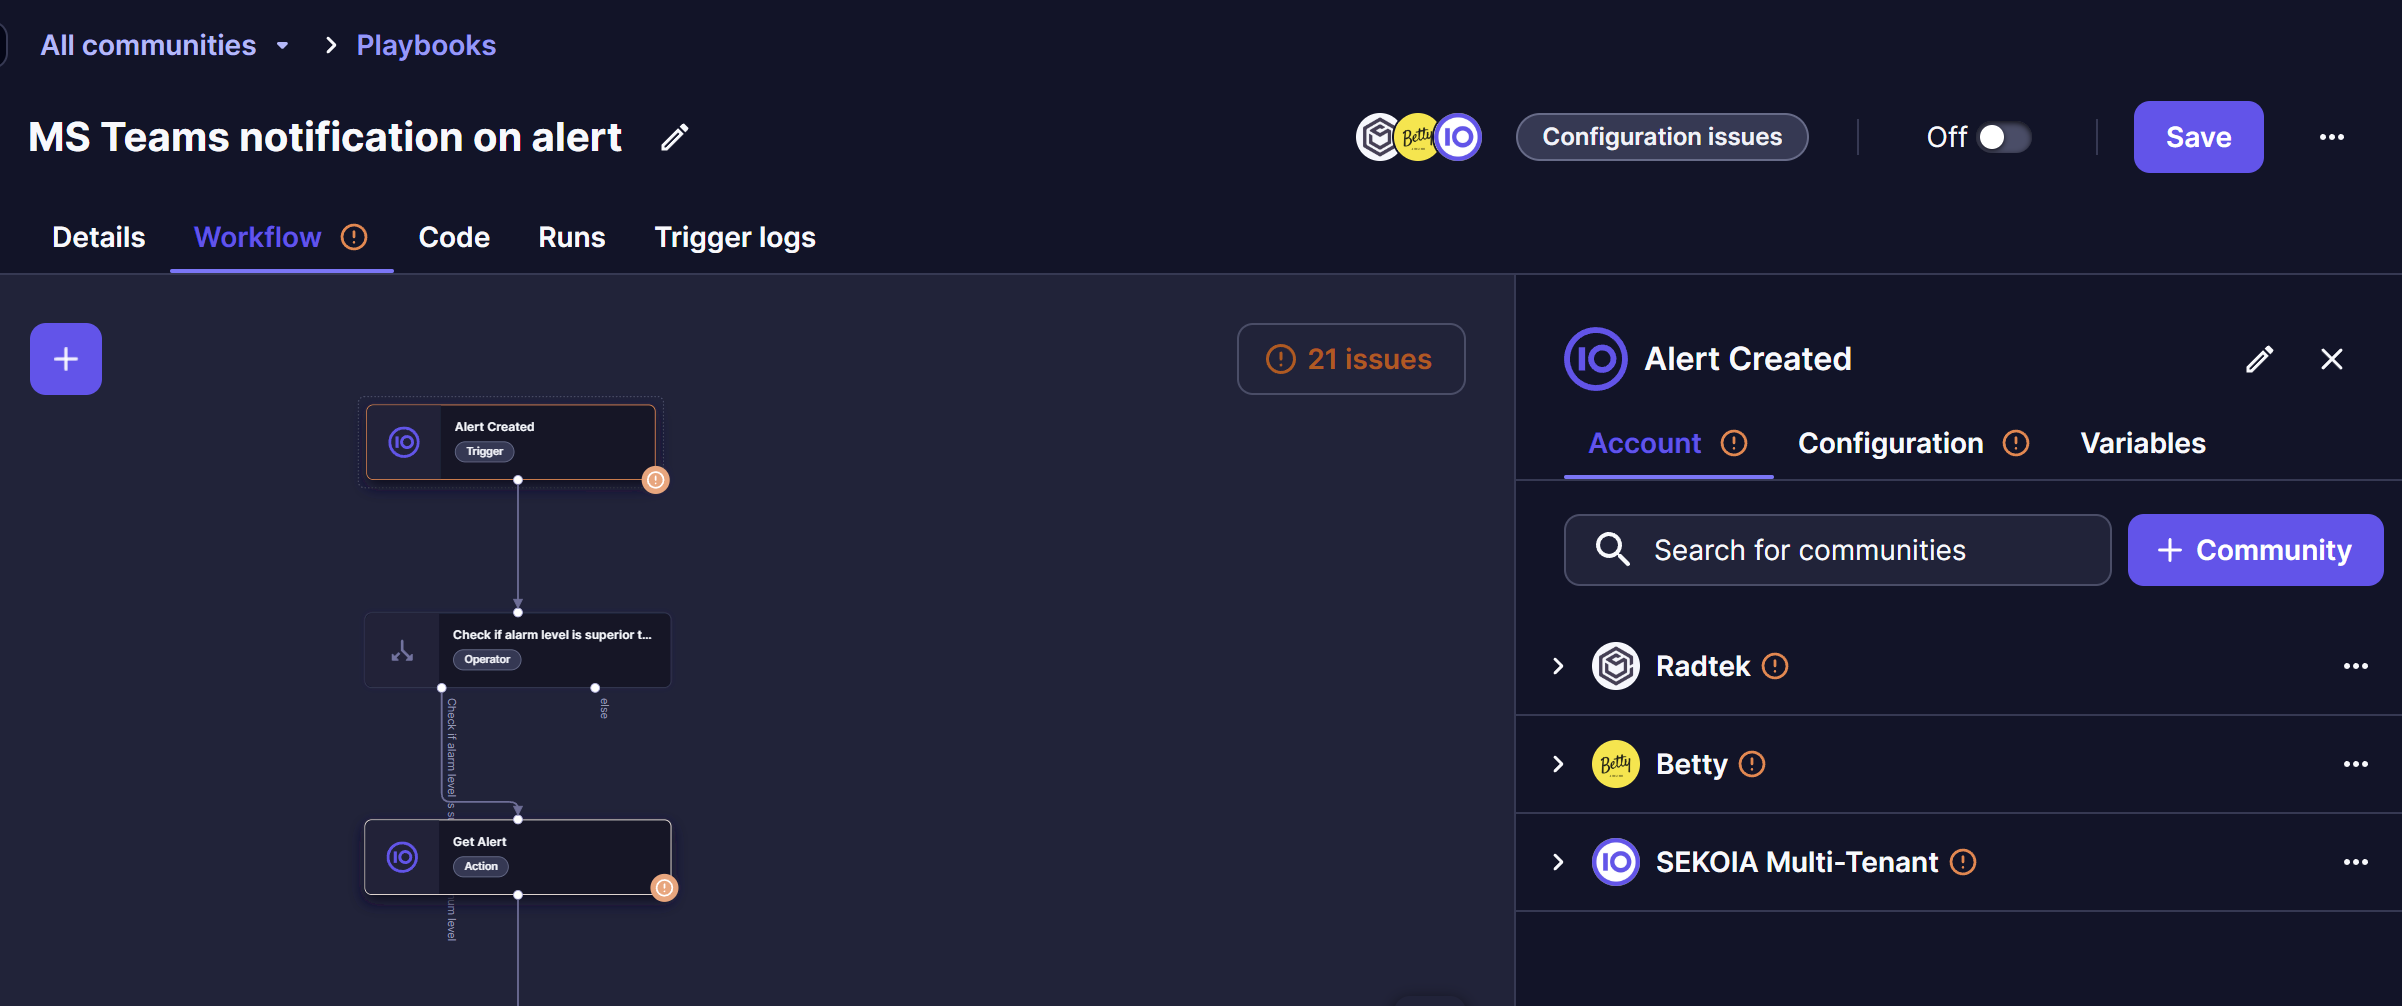
To access the detailed view of a playbook just simply click on the applicable playbook card. Once on the playbook page, you should now see some ‘warning’ icons on tabs and inside configuration panel. These icons are here to guide you when there are some issues to resolve before the playbook can be activated.
You can also now save your playbook from any tab, the save button is now in the header part of the playbook
Some badges have been added to have a status about the playbook:
- Configuration issues: some/all communities have some configuration issues detected. By clicking on it you’ll be redirected to the Workflow tab with the issue panel opened
- Partially activated : some communities are running but not all of them. By clicking on it you’ll be redirected to the overview tab
- Ready to start: there are no configuration issues on any community, playbook can be activated
- Failed runs: some runs have failed. By clicking on it you’ll be redirected to the runs tab with a “failed” filter set
- Trigger crashed: there is a log with criticy level "critical” inside the “Trigger logs” tab. By clicking on it you’ll be redirected to the Trigger logs tab with a “critical” filter set
Overview
This tab Overview lists all information related to the playbook:
- The community where the playbook was created
- The user who created the playbook
- The user who last updated the playbook
- Date of creation
- Date of last update
- Name of the last user who activated the playbook
- Date of the last activation of the playbook
- Description of the playbook
- Community details, including the ability to add or remove communities, activate or deactivate communities for a given playbook, and review playbook statuses by community (e.g. configuration issues, failed rules or crashed triggers)
Workflow
The workflow view is composed of three main sections:
Actions library
Accessible in a side panel that appears when clicking on the + on the left of the screen, this library provides you with a set of triggers, actions and operators to help automate your workflow.
These actions are regrouped in apps and services that are interconnected with Sekoia.io.
To find actions in the listing, you can either:
- Use the search bar inside the panel
- Use filters to list only Actions or Triggers
To add these actions to your graph, click on the dots next to the action name and drag it to the graph area. Dropping actions into this area will form a block.
Note
Configuration for each of these blocks is detailed in the Library section of this documentation.
Graph area
This is where you can add and connect your blocks to form a playbook.
Playbook blocks are visually composed of:
- The logo of the app/service
- The name of the action
- The type of block (Action, Operator, Trigger)
- The status of the block (Valid, In error)
- Connectors
| Actions | Description |
|---|---|
| Zoom in/out | Either using the mouse or the action buttons |
| Fit Diagram | Lets you see all your blocks |
| Undo | Undo last action |
| Redo | Redo action |
Note
If blocks in the playbook have missing configuration, an alert stating the number of errors will show in the left of the graph area.
The playbook run view adds color to the playbook blocks and nodes to highlight the status of the run.
| Color | Meaning |
|---|---|
| Green | Playbook run went successfully |
| Orange | Playbook run left from this node |
| Red | Run ended in error |
Configuration panel
When clicking on a block in the graph area, the configuration panel opens on the right of the screen.
Depending on the type of blocks, the content of the configuration panel changes.
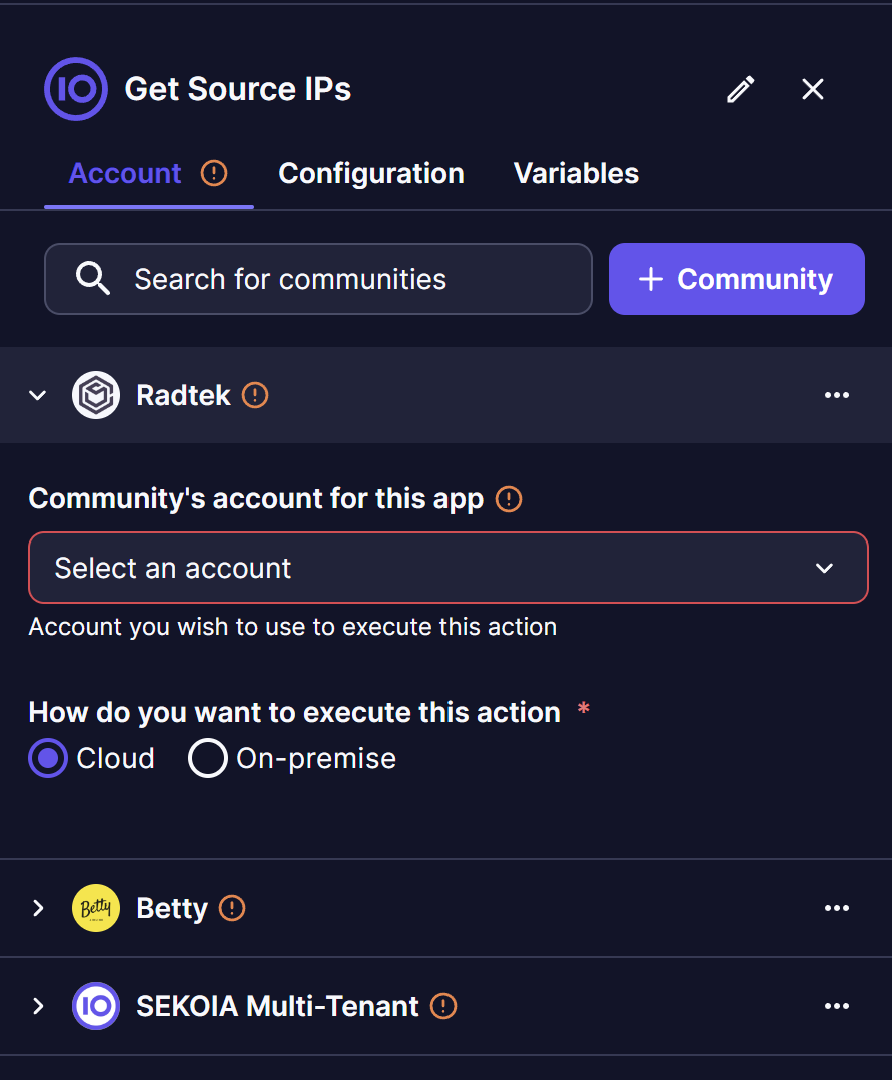
Triggers
You can edit the trigger name directly in the header part.
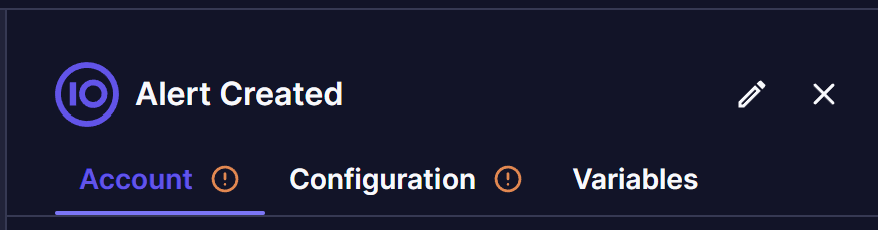
| Tabs | Content |
|---|---|
| Account | Lists the Module Configuration (possibility to create/edit/delete) - For MSSP : you’ll see one account by community |
| Configuration | Lists the available Trigger Configurations, you can add/edit/delete |
| Variables | Variables and their values |
For MSSP, there is a section for each community added into playbook on the Account and Configuration parts for Triggers.
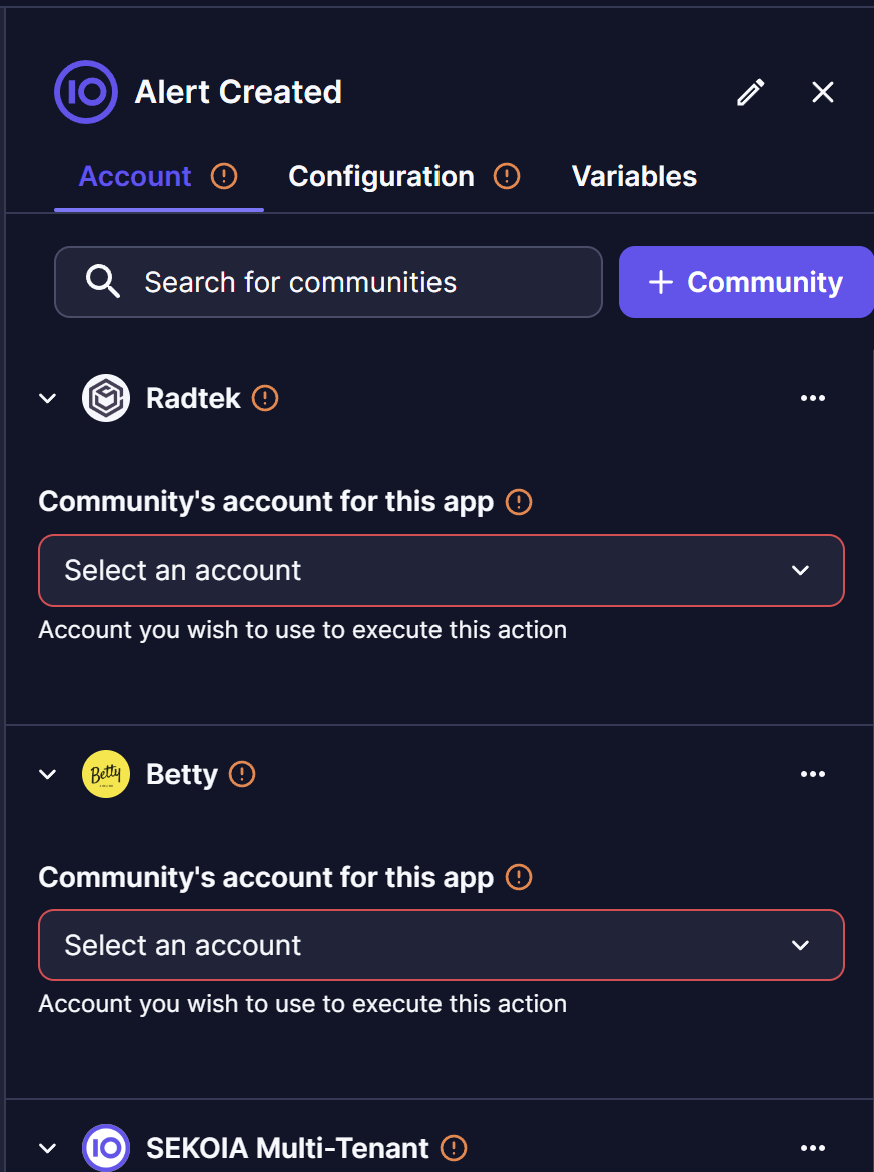
You can also add a new community with “+ Community” button and choose between your remaining communities.
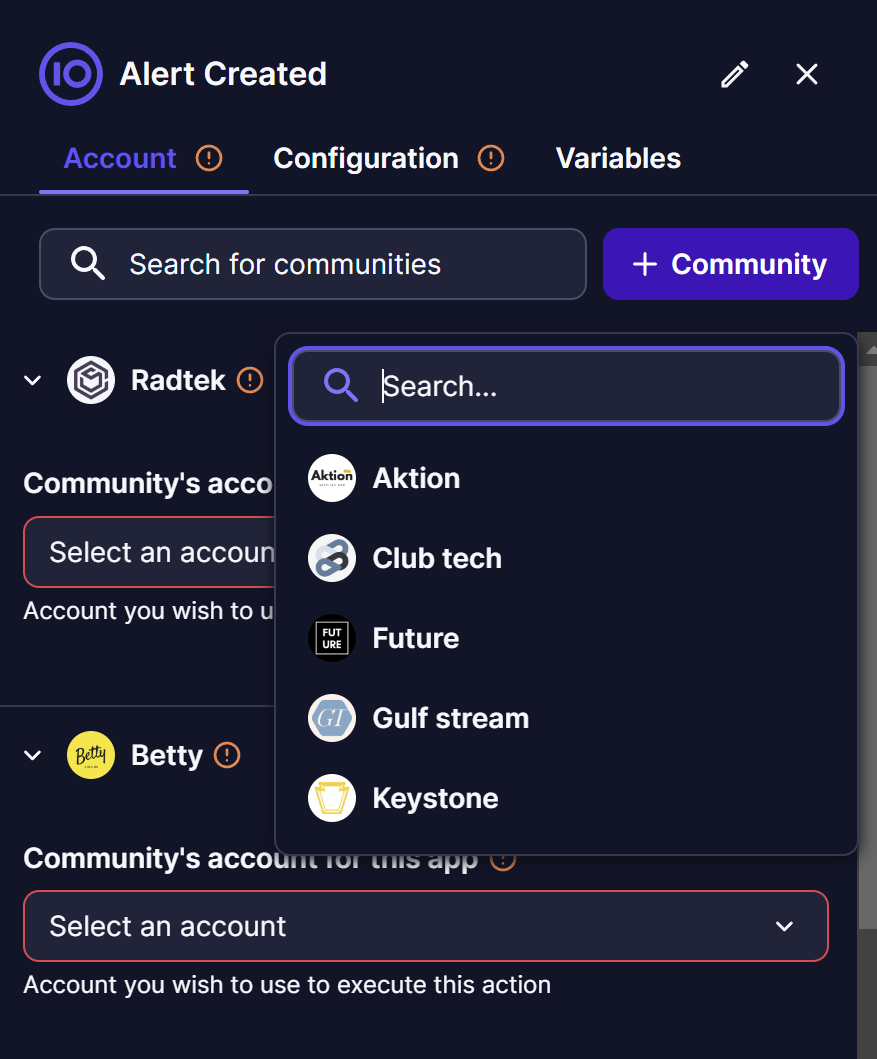
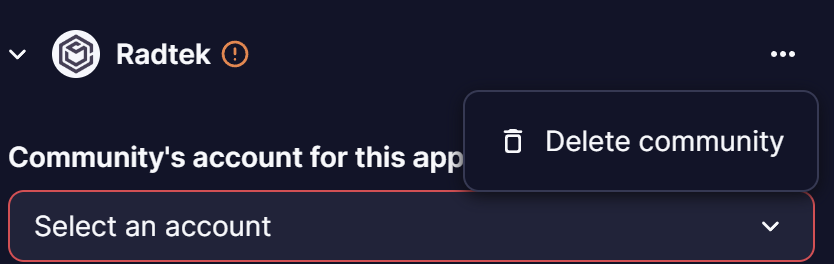
Community selection is made by clicking on it. To delete a community from a playbook, a “…” button can be found on community section header. By clicking on it, it will show a “Delete community” option.
Operator
Condition
| Section | Content |
|---|---|
| Name | The name of your operator that can be edited |
| Cases | List of comparisons to be made (Either with a variable or by adding a form) |
Foreach
| Section | Content |
|---|---|
| Name | The name of your operator that can be edited |
| Items | List of data that should be browsed |
| Variables | Lists all variables related to the action. Contains name and description of the variable as well as a copy button to easily copy the value of the variable |
Store
| Section | Content |
|---|---|
| Name | The name of your operator that can be edited |
| Modifications | List of modifications to make. To add a modification, hover over the title and click on one of the buttons that appear (Use variable, add one entry to array) |
| Use a variable | Field where you can paste the value of a variable |
| Add form | A form with 3 main items to fill: key, type and value (more details here) |
Action
You can edit the action name directly in the header part.
| Tabs | Content |
|---|---|
| Account | Lists existing configuration that may apply to your action. If no configuration is available, you can create a new one by clicking on Create new configuration OR edit an existing one - For MSSP : you’ll see one account by community |
| Configuration | Varies depending on the selected action. Contains a search bar as well as all configuration steps. The height of fields in this section can be extended by dragging the mouse on the lower right of the field |
| Variables | Lists all variables related to the action. Contains name and description of the variable as well as a copy button to easily copy the value of the variable |
Note
You can manually resize the configuration panel by clicking on the left edge of the panel and dragging the mouse left or right; the width of the panel will change accordingly. Once your panel is set at a preferable width, let go of the mouse. The chosen size will be remembered for the next configurations.
For MSSP, there is a section for each community added into playbook on the Account tab.
Please see above “Triggers” part to see how to add or delete a community from a playbook
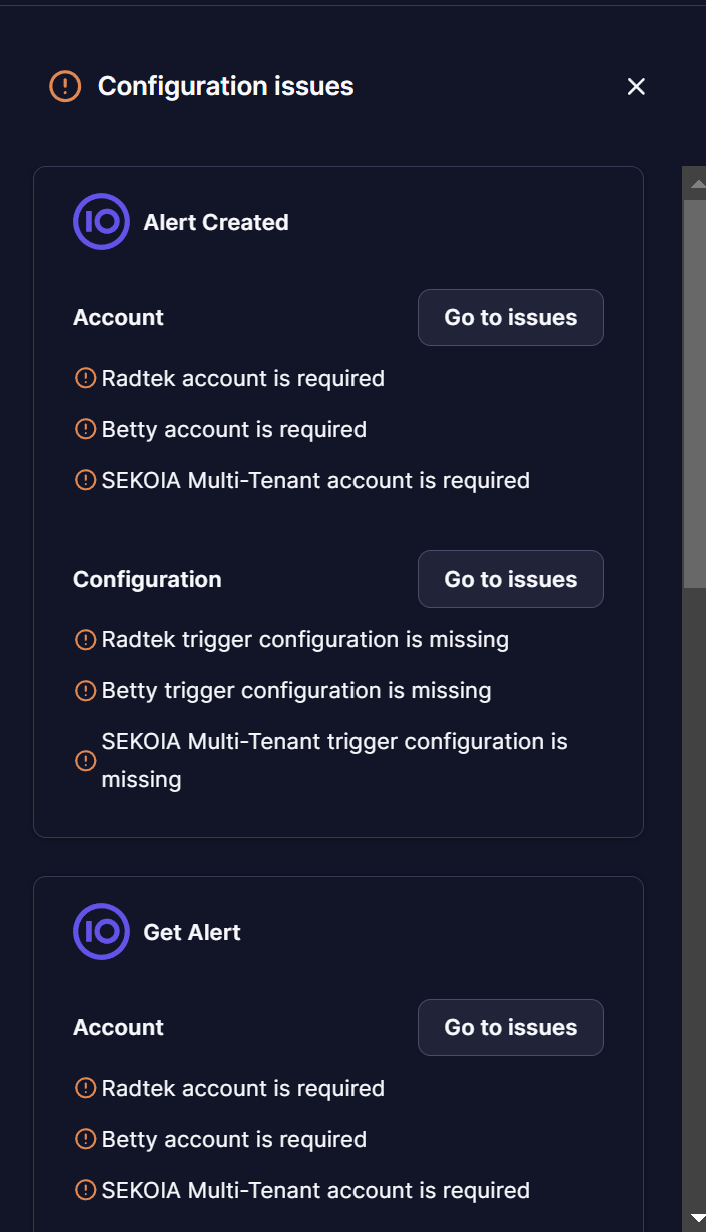
Issue panel
The issue panel has been enhanced to give details about the configuration issues in playbook for each community (in a MSSP context). When clicking on the “Go to issues” button, you’ll redirected directly on the right module and tab (Account/Configuration) to resolve the issue.
Code
The code section is where you can find your playbook in JSON. You may use JINJA 3. to fill variable fields.
It is possible to test your JINJA code on a JSON file:
- Copy/paste the code of your playbook
- Remove the nodes with this Python script:
import json
from jinja2 import Template

file_json = open("file.json", "r")
loading = json.load(file_json)

# The JINJA pattern to be tested
jinja_pattern = "{{urgency.value}}"

tm = Template(jinja_pattern)

msg = tm.render(urgency=loading["urgency"])
print(msg)
Runs
The tab Playbook runs lists all runs that happened in the last week.
The header points at the total number of playbook runs in the last week, the ones in progress, have succeeded and have failed.
Under these stats lays a table with the following information:
- The event (the run)
- When it started
- Its status
- The duration of the run
- A rerun button to restart the run
To access the details of a run, just click on the run and you’ll be redirected to the graph view with the status of each block.
From the graph view, click on the block of interest and the panel Run results will show.
This tab includes filters for sorting by Status. Additionally, 'Meta-Playbooks' allows for filtering based on specific Communities.
Run results
Run results are accessible either from the tab Runs in the playbook or in the panel that details a playbook's details.
This panel contains the following information:
- The status of the run
- Its timeline (when it started, how long the run lasted, when it ended)
- Arguments
- Results (logs and errors)
To switch to the block’s settings, click on the edit button on the top right of the panel.
To switch back to run results, click on the button Switch to run results button.
Trigger logs
This tab allows user to see all logs from a trigger configuration. It is usefull to quickly see configuration errors and to know why playbook is not working properly.
This tab includes filters for sorting by Level (e.g. Critical, Debug, Info, etc.). Additionally, 'Meta-Playbooks' allows for filtering based on specific Communities.