Anomaly Detection Rules
You can use Sekoia.io Anomaly Detection Rules to analyze time series data, identify anomalous patterns and raise alerts.
Anomaly detection rules are based on machine learning anomaly detection features automating the analysis of univariate time series data by creating accurate baselines of normal behavior in your data. These baselines are used to identify anomalous patterns in your time series data and raise alerts with different levels of criticality.
This module provides 1-Dimensional time series chart illustrating historical and current data values, forecasting for a specified date range, upper and lower bounds for the expected values, and the anomalies that occur outside these bounds with criticality score.
Plan your anomaly detection analysis
The machine learning features enable you to seek anomalies in your time series data combining temporal deviations in values, count of frequencies and statistical rarity.
For now, these features only tackle univariate anomaly detection. If you are uncertain how to use anomaly detection rules and whether it is relevant, you have to answer the following questions:
- Am I interested in monitoring deviation of a specific metric compared to its historical data?
- Does my time series have some periodic seasonalities (daily seasonality/weekly seasonlaity)?
If yes, you can create an anomaly detection rule. An additional tool for specifying if time series data is a good candidate is set to ensure relevancy.
Create anomaly detection rule
Anomaly detection rules contain the configuration information necessary to perform the machine learning analysis. They can run for a specific time period or continuously against incoming data.
For a complete configuration, you need to set:
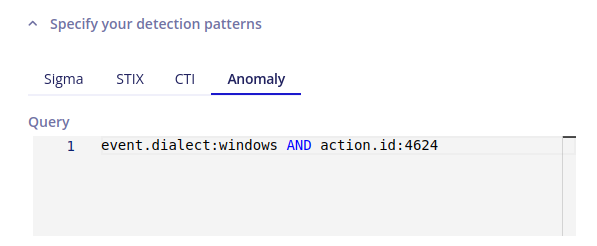
- a filter query (to aggregate events from a specific area)
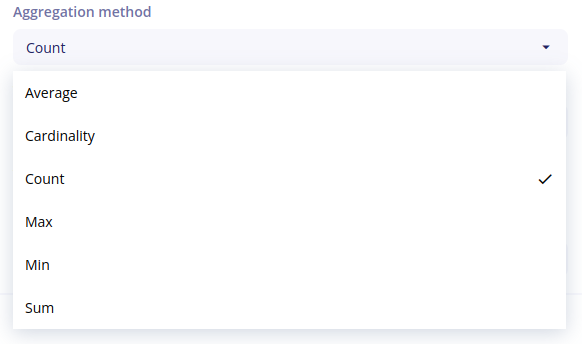
- aggregation method (
Average,Cardinality,Count,Max,Min,Sum)
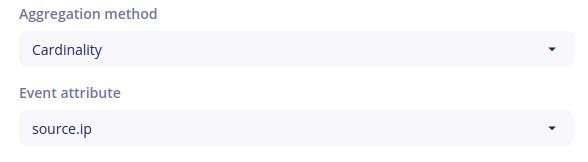
- field to aggregate if aggregation method is not
Count(ex: source.ip, destination.bytes ...)
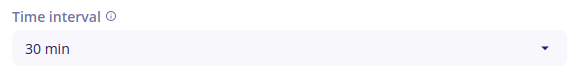
- bucket time interval (
10 min,30min,1 hour,6 hours,12 hoursor1 day)
Note
Time to raise an anomaly alert equals 30 minutes + 2*time interval The anomaly alert is raised after it matches the detection pattern based on the selected aggregation mechanism.
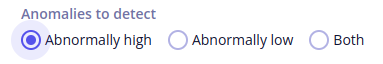
- type of anomalies you want to detect (high, low or both)
- minimum anomaly score raising alerts (
Low,MediumorHigh) - severity of the rule
Aggregation methods
- Count: count events per bucket (for a specific filter or field set to a value)
- Cardinality (only for string data): count cardinality of values per bucket
- Sum (only for numerical data): aggregate sum of field values per bucket
- Min (only for numerical data): aggregate min of field values per bucket
- Max (only for numerical data): aggregate max of field values per bucket
- Average (only for numerical data): aggregate average of field values per bucket
Visualization
As a result, for a rule that aims to monitor the volume of services installed on systems (query filter: event.dialect:windows AND action.id:4697, with a Count aggregation method and a 10 min time interval), we obtain:
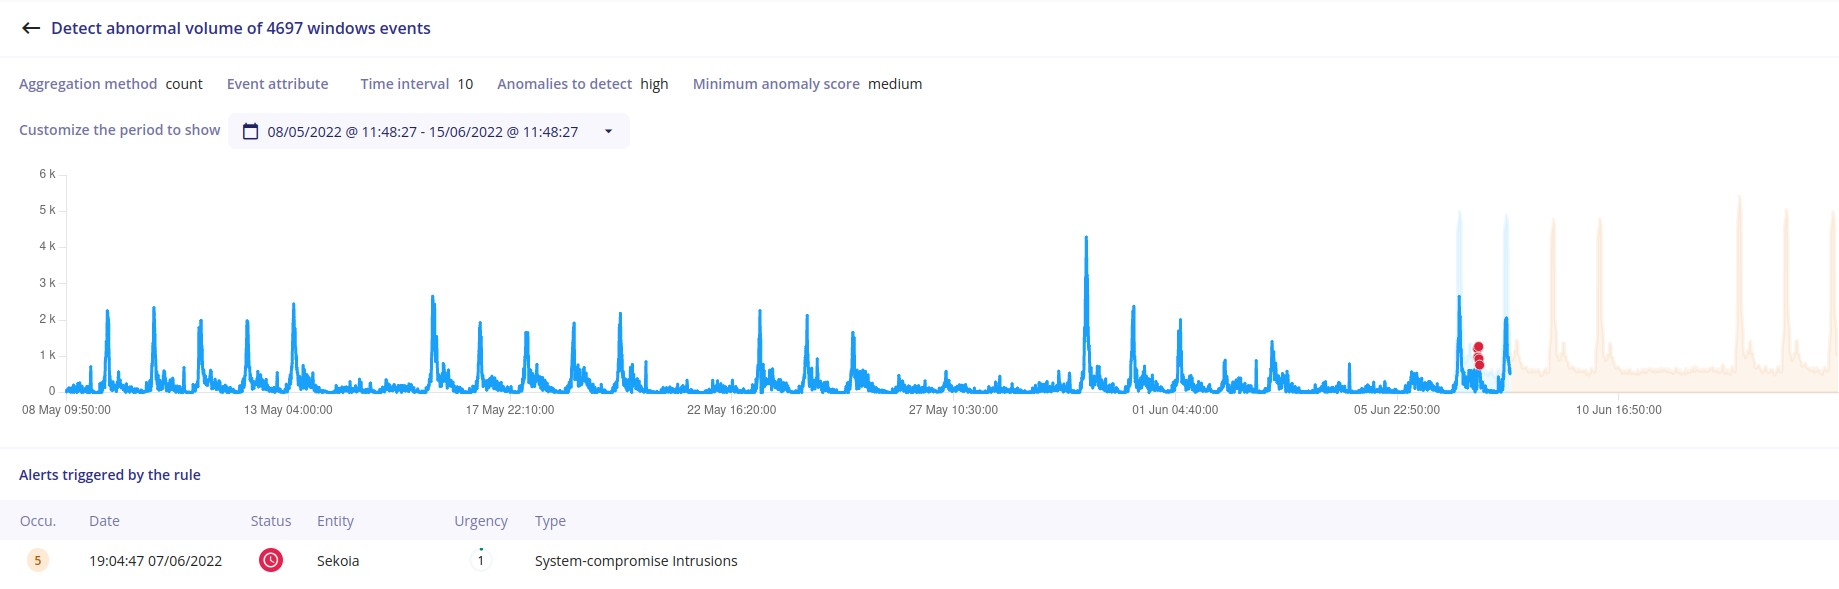
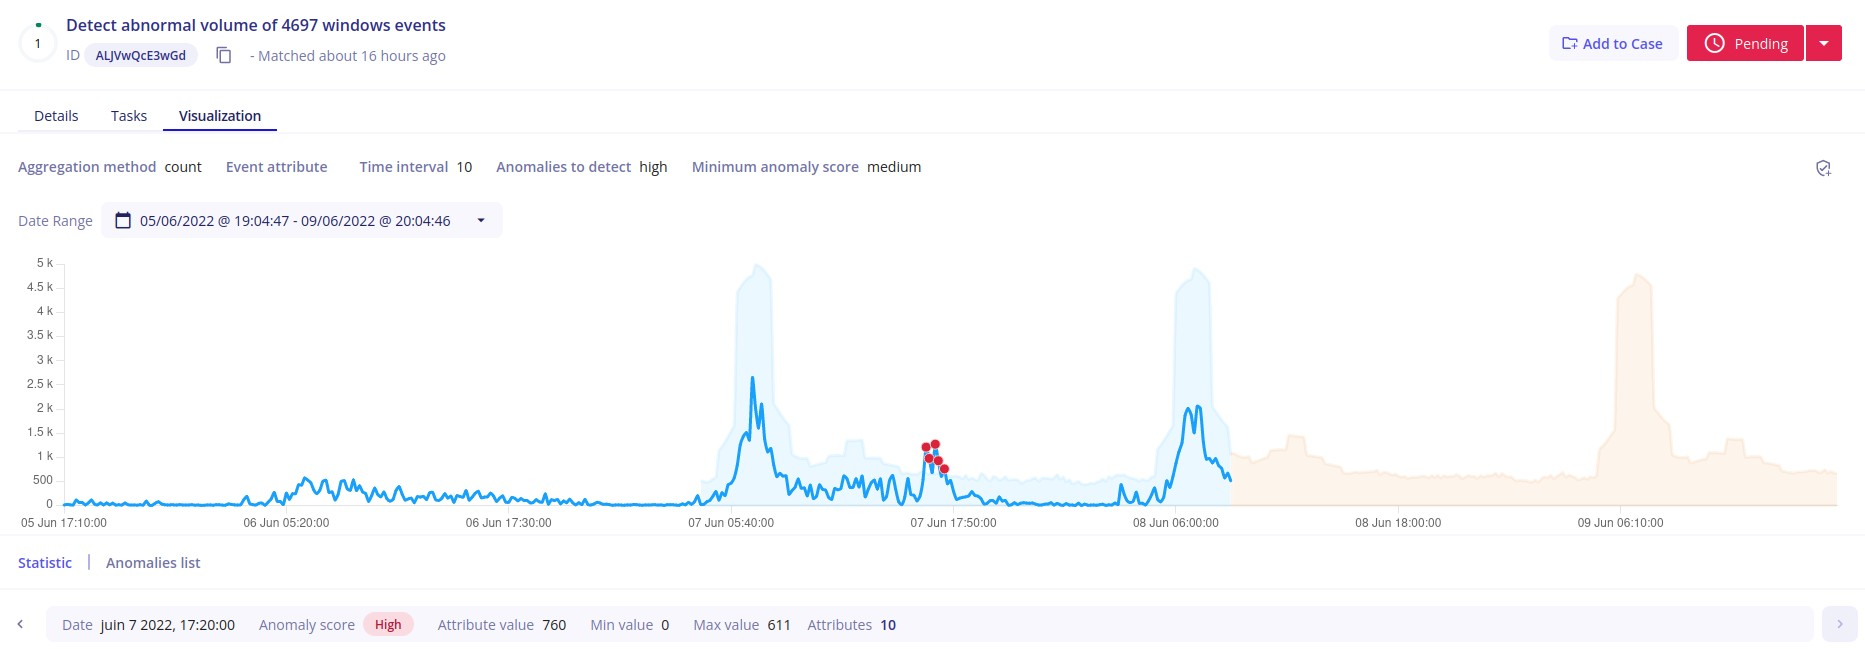
The anomaly identified raises an alert that you can visualize as follows.
Known Limitations
Anomaly detection relies on UTC time. During a time change (transition to/from daylight saving time), the UTC-based patterns may shift by one hour, potentially triggering abnormal behavior alerts. It may take a few days for the anomaly detection engine to adjust to this new pattern.