Configure Sekoia.io XDR in 5 minutes
Introduction
Following the creation of a new community, which represents your instance that is provided to you with the licence, there is a set of standard configurations on Sekoia.io Operations Center pages that needs to be completed. This note summarises a guidance on the primary steps to be taken in the first few minutes of setting up a community.
The full guide on how to create and set up an account, create and invite users to a community, manage roles, permissions and notifications and much more, is available here.
Let's get started
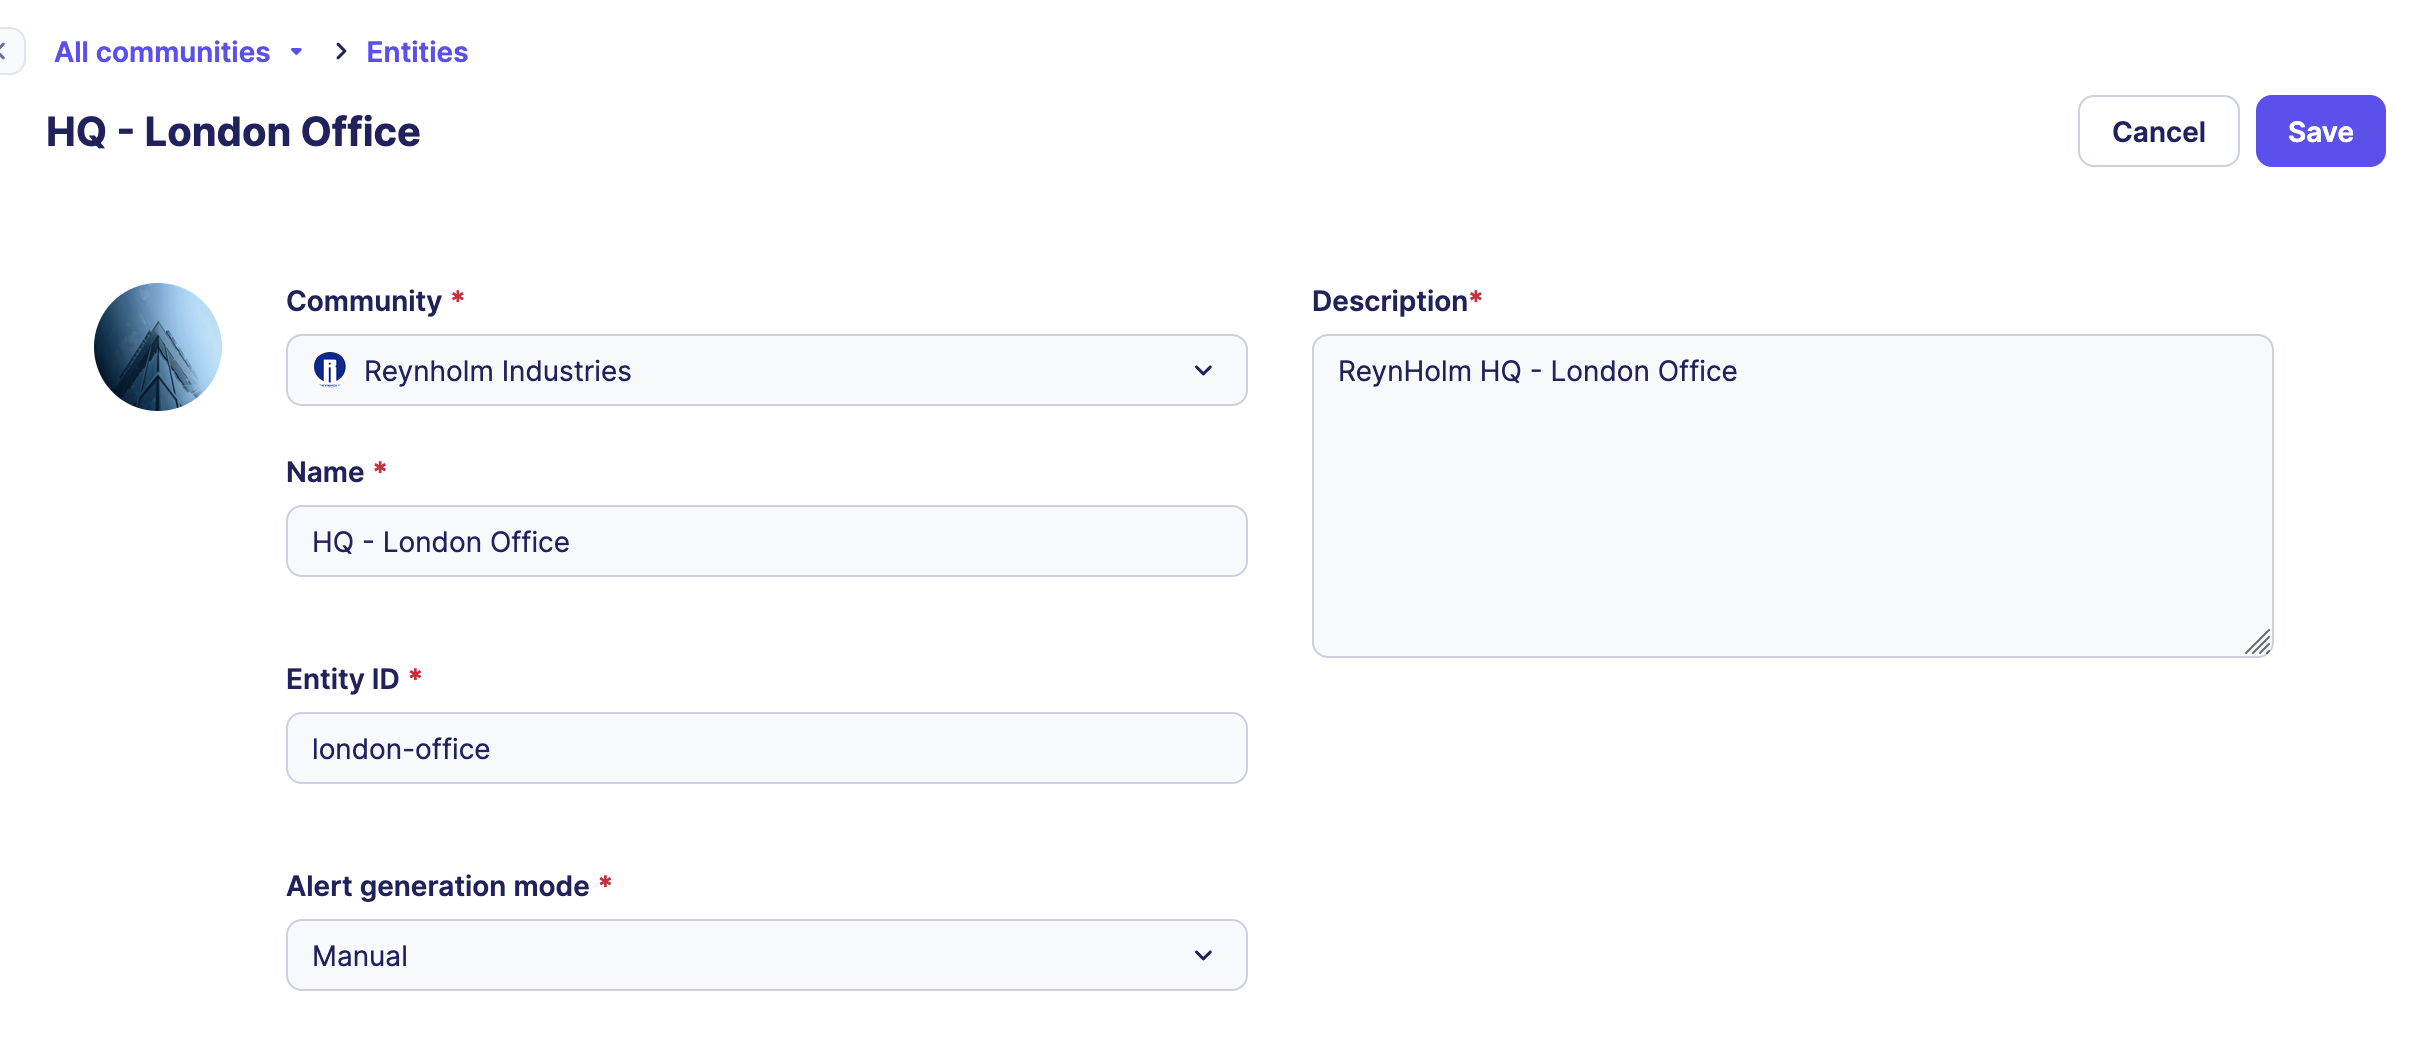
Create an entity
An Entity is an organizational unit mostly used for configuration and reporting easiness. Entities allow a logical grouping of your data sources and associated alerts.
- Go to the Entities page and create an Entity.
- Select the
Alert generationmode of your choice. We suggest you to select “Automatic” which will simplify the workflow of alert management for you. More details here.
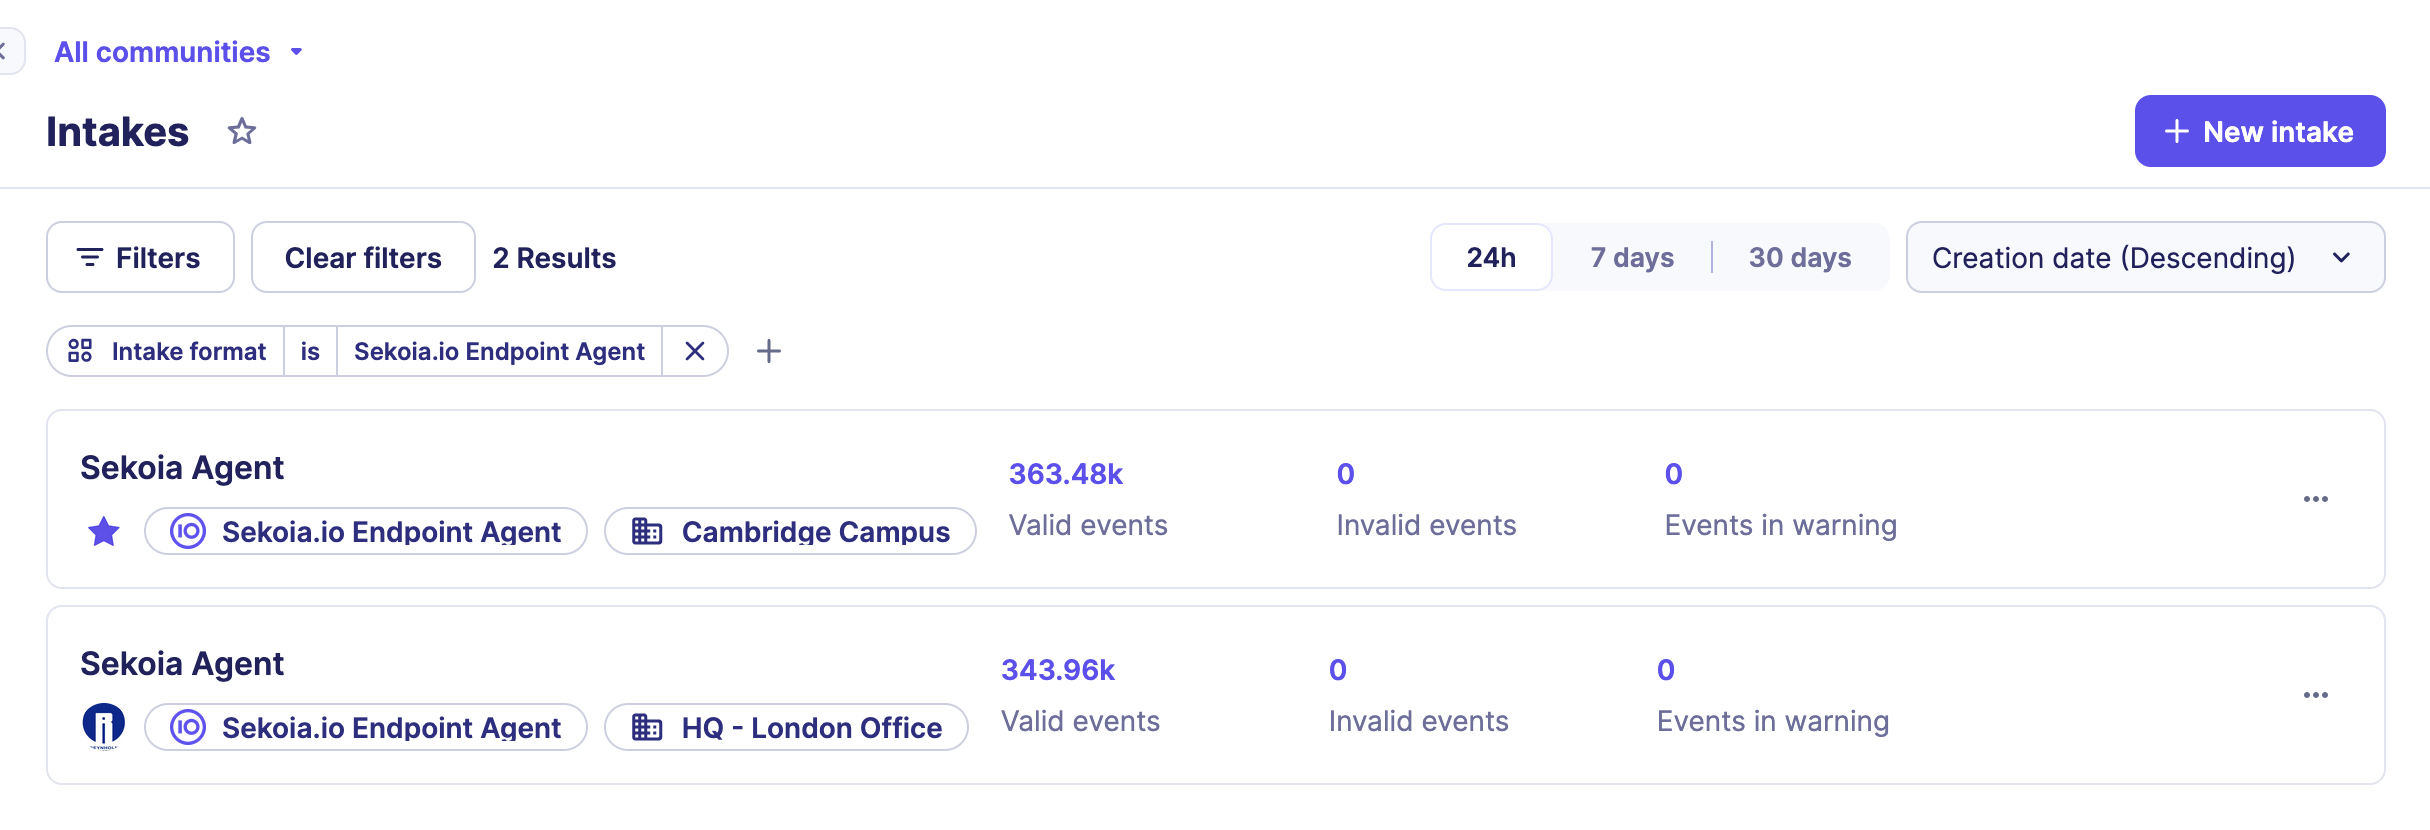
Create intakes
The Intakes correspond to the different technologies used (also called Data Sources) that forward their logs to Sekoia.io XDR to be centralized for security monitoring. You can configure as much intakes as you need to increase your infrastructure security with Sekoia.io knowledge.
To create intakes associated to the technology you would like to collect:
- Go to the Intakes page and create intakes one by one from the catalog.
- Make sure the logs are pushed to Sekoia.io using syslog or HTTPS protocols providing the
Intake keyaccordingly, or pulled by API.
Note
Find more details on each integration in our integrations catalog.
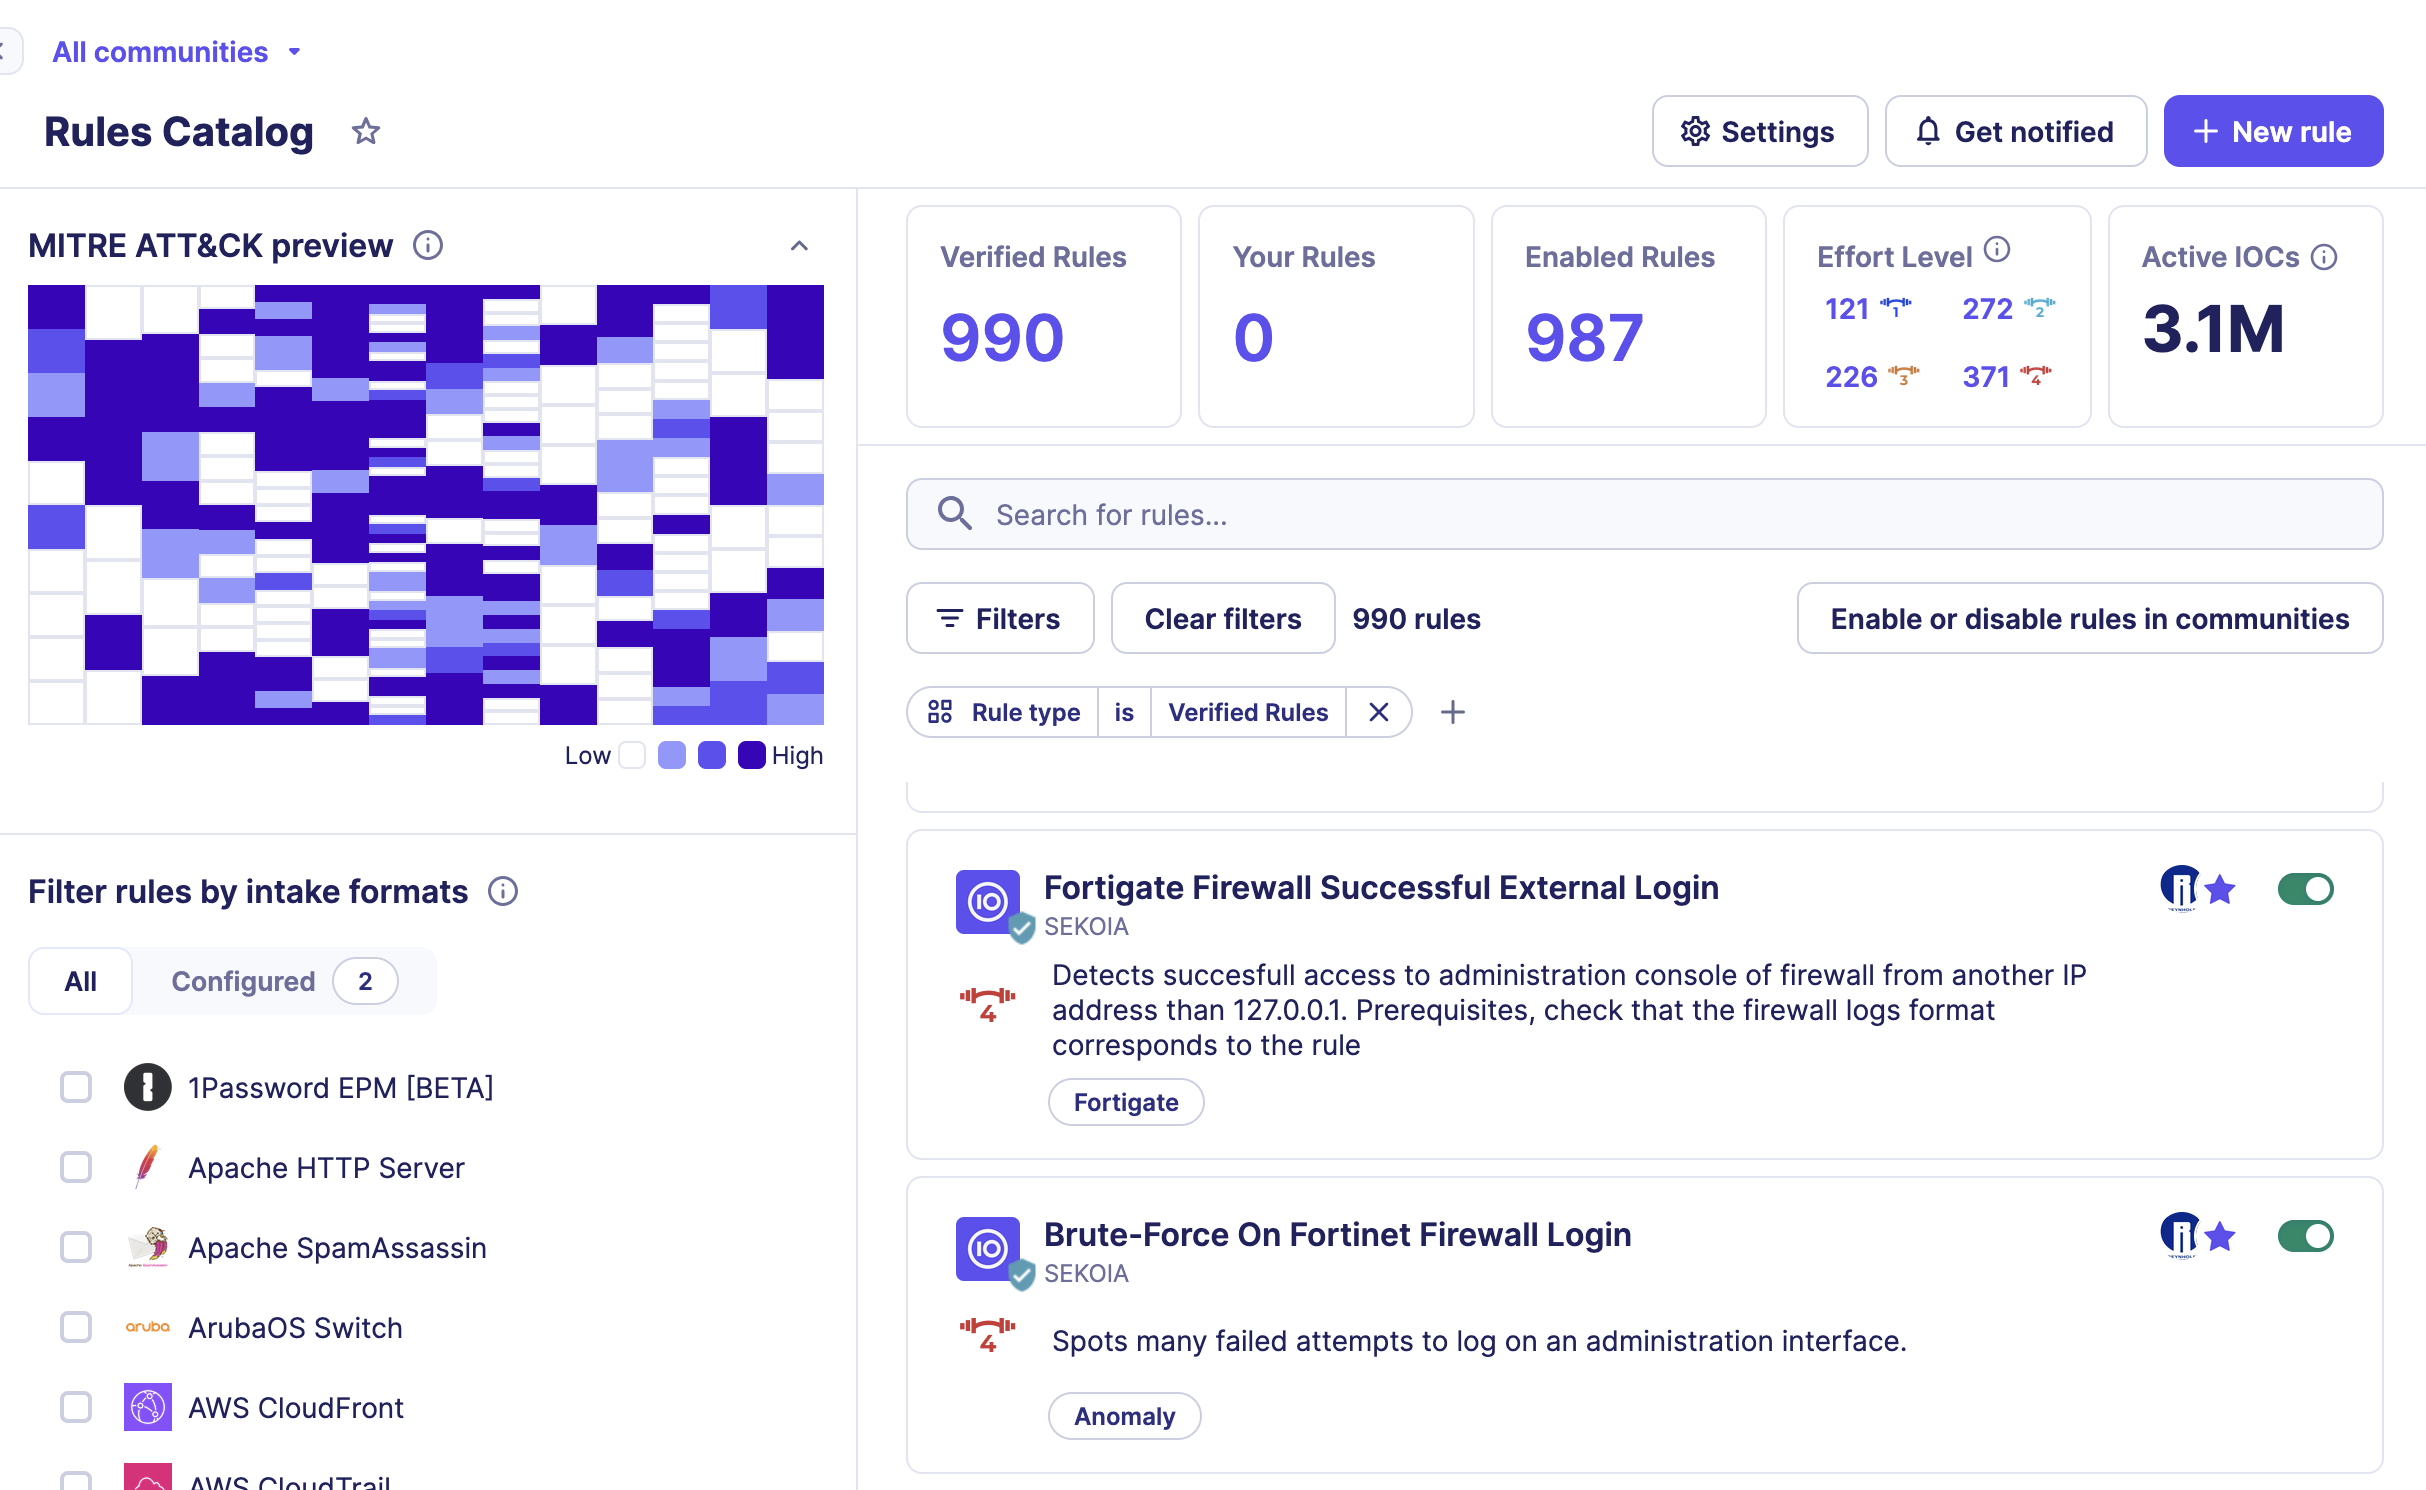
Activate detection rules
Once your event logs are collected and normalized by Sekoia.io, you probably want to leverage them to detect suspicious activity within your perimeter. Rules contain the detection logic that determines when Alerts should be created.
- Enable all detection rules of effort levels 1 or 2 by filtering on each effort level then clicking on the
Enable allbutton. - Automate the activation of future detection rules with the same effort levels following this procedure.
That’s it!
And then what?
The Events page provides a centralized view of your events and enables in-depth investigation in the latest logs sent to Sekoia.io. With its query-based search bar, the possibility to easily add and remove filters and its new aggregation tool, this page lets you sort, filter, analyze and visualize logs in an efficient manner.
Enjoy your collected Events and investigate latest logs sent to Sekoia.io with its query-based search bar.
When events match the pattern of your activated detection rules, this will raise an Alert to be investigated. If you consider it as a True Positive, change its status from Ongoing to Closed and add a comment that synthesis your analysis.
More information
Feel free to configure and customize your community to fit your needs, using other features as listed here.