New Relic Alerts
Overview
New Relic is a cloud-native observability platform for real-time monitoring of applications, infrastructure, logs, and metrics. It offers unified dashboards, AI-powered alerts, and distributed tracing to quickly detect and resolve anomalies. Teams use New Relic to optimize performance, reliability, and user experience across digital environments.
Warning
Important note - This format is currently in beta. We highly value your feedback to improve its performance.
- Supported environment: SaaS
- Detection based on: Alerts
- Supported application or feature:
- Alerts
Step-by-Step Configuration Procedure
Instruction on Sekoia
Configure Your Intake
This section will guide you through creating the intake object in Sekoia, which provides a unique identifier called the "Intake key." The Intake key is essential for later configuration, as it references the Community, Entity, and Parser (Intake Format) used when receiving raw events on Sekoia.
- Go to the Sekoia Intake page.
- Click on the
+ New Intakebutton at the top right of the page. - Search for your Intake by the product name in the search bar.
- Give it a Name and associate it with an Entity (and a Community if using multi-tenant mode).
- Click on
Create.
Note
For more details on how to use the Intake page and to find the Intake key you just created, refer to this documentation.
NewRelic forwarding configuration
-
Log in the New Relic Console
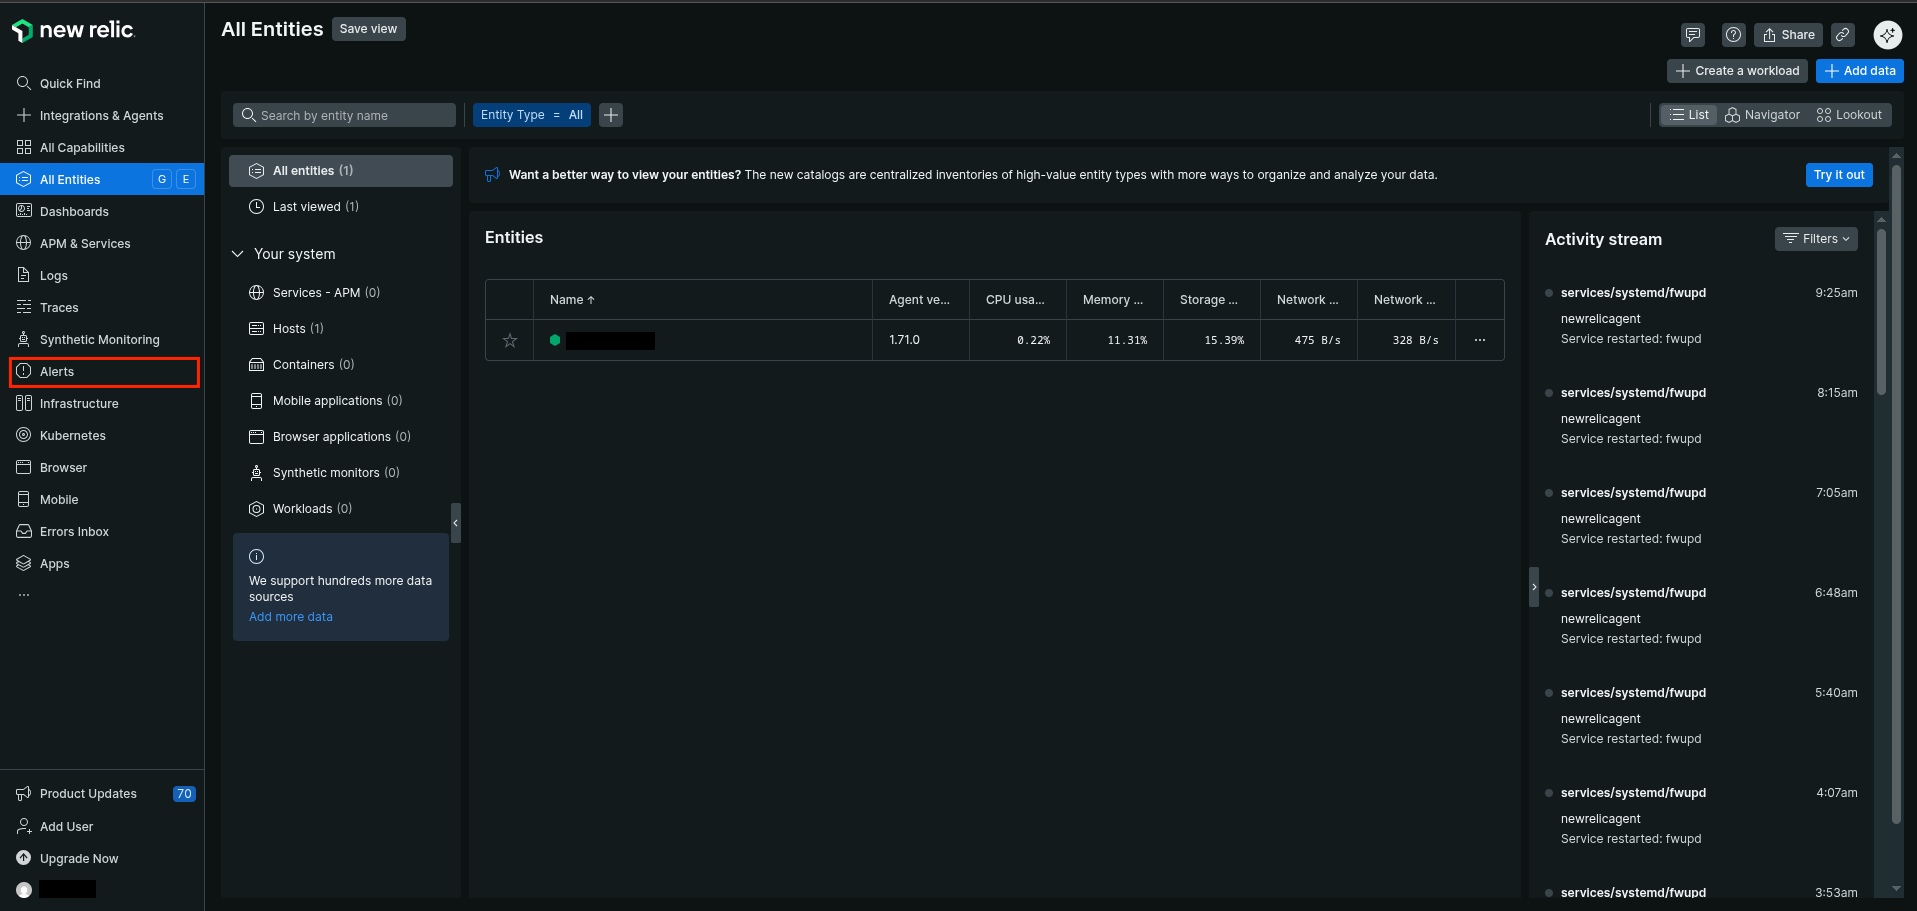
-
Go to
Alerts > Destinations -
Click
Webhook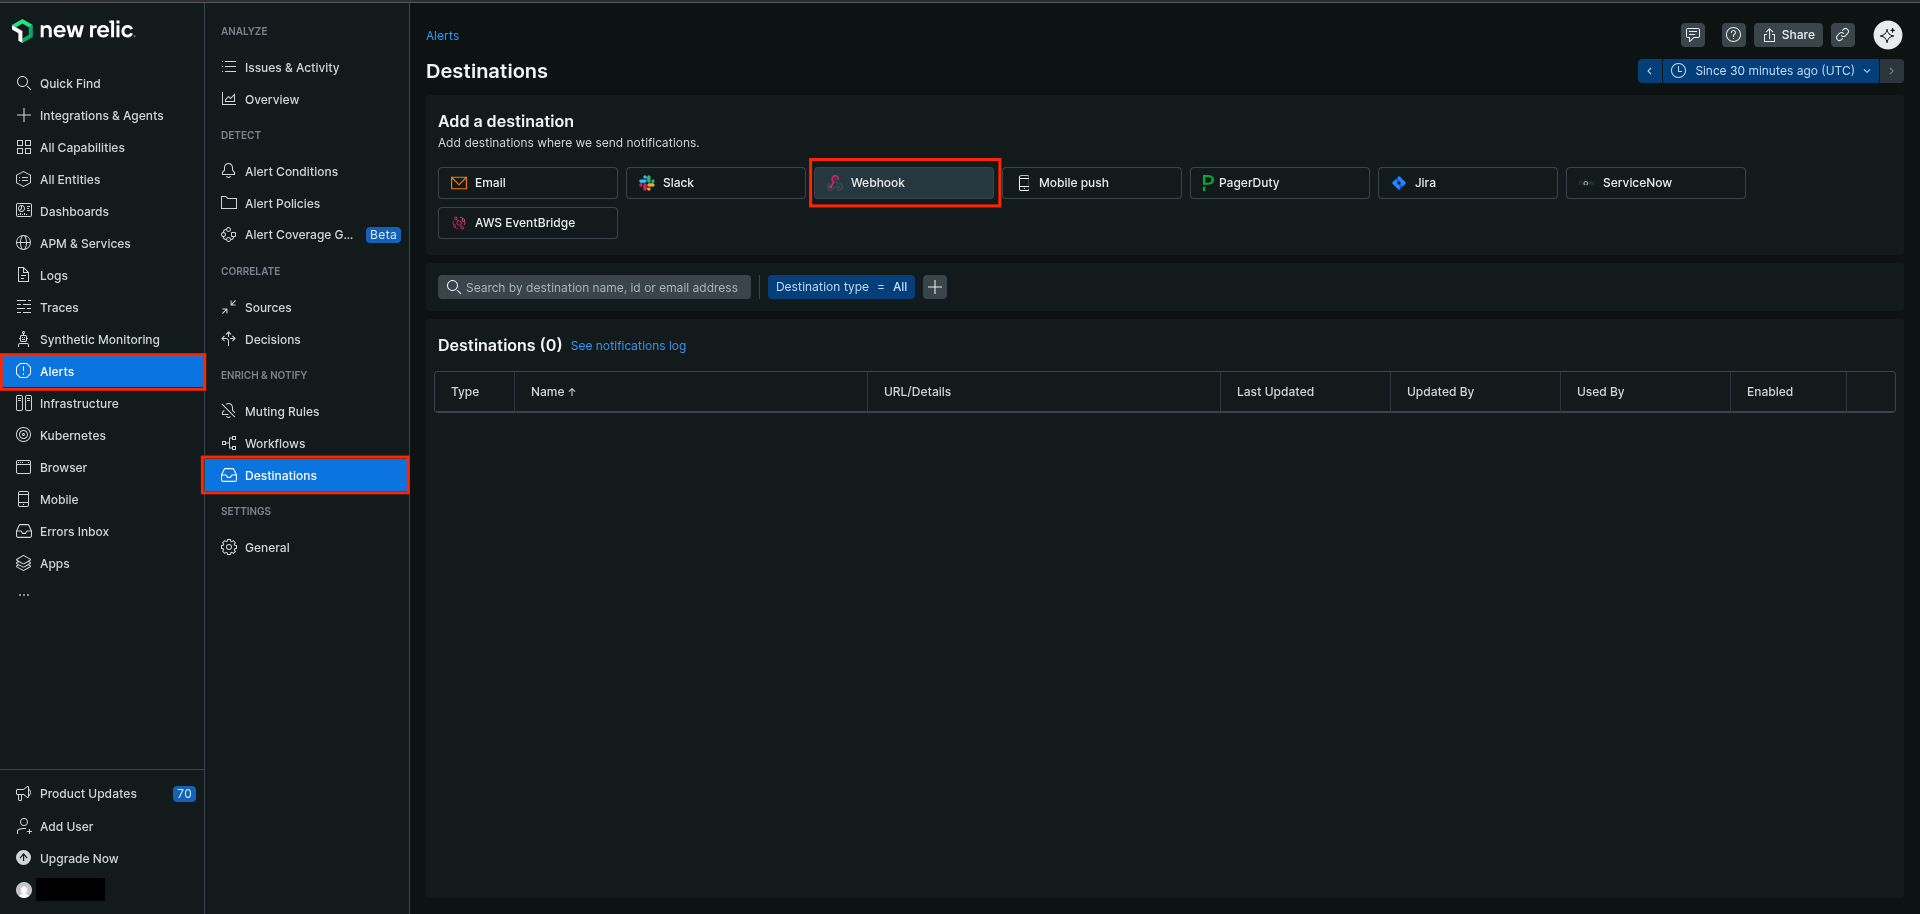
-
Type a name for the destination (e.g
Sekoia.io Alert Forwarding) - Set
https://intake.sekoia.io/plainas the endpoint URL
Warning
The previous URL works for the FRA1 region. For any other region, replace the domain “intake.sekoia.io” with your region’s HTTP-intake domain—for example:
https://app.usa1.sekoia.io/api/v1/intake-http
You can find your region’s domain here: https://docs.sekoia.io/getting_started/regions/
- Select
Basic authorizationas authorization method - Type any username (NewRelic requires a non-empty username to validate the form)
- Set the Sekoia.io intake key as the password
-
Click
Save destination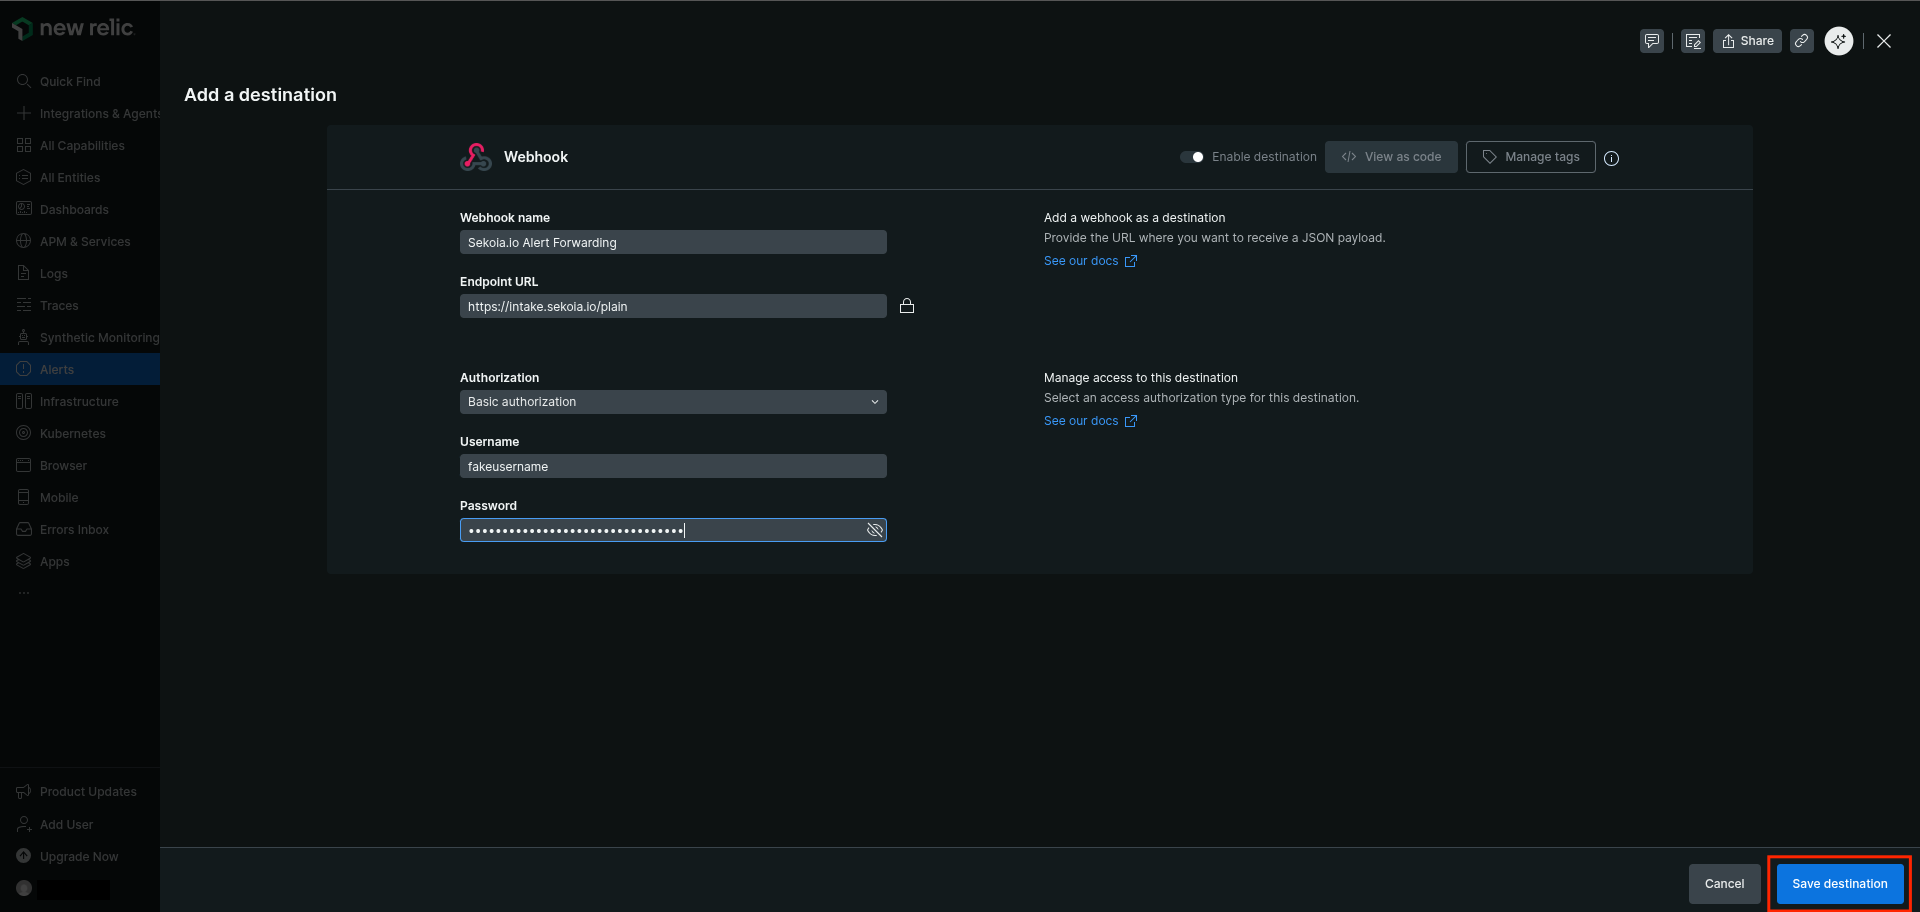
-
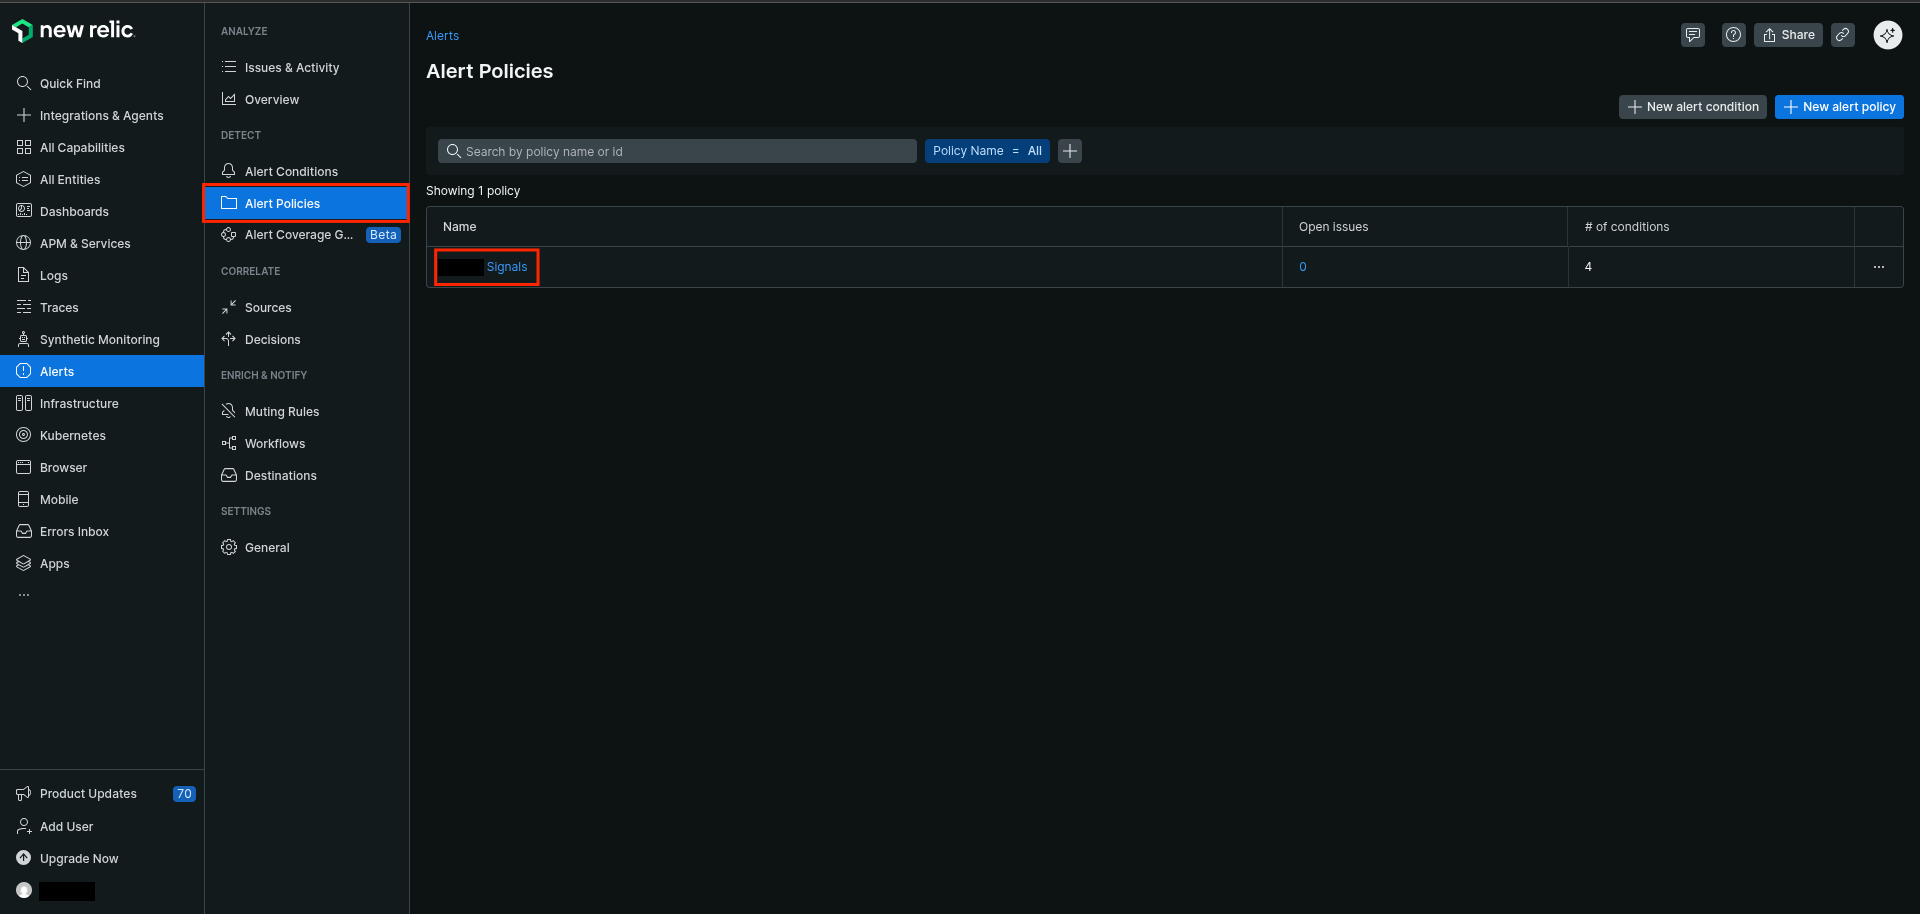
Go to
Alerts > Alert Policies -
Click on the alert policies you want to configure
-
Go to
Notificationtab -
Click
Create workflow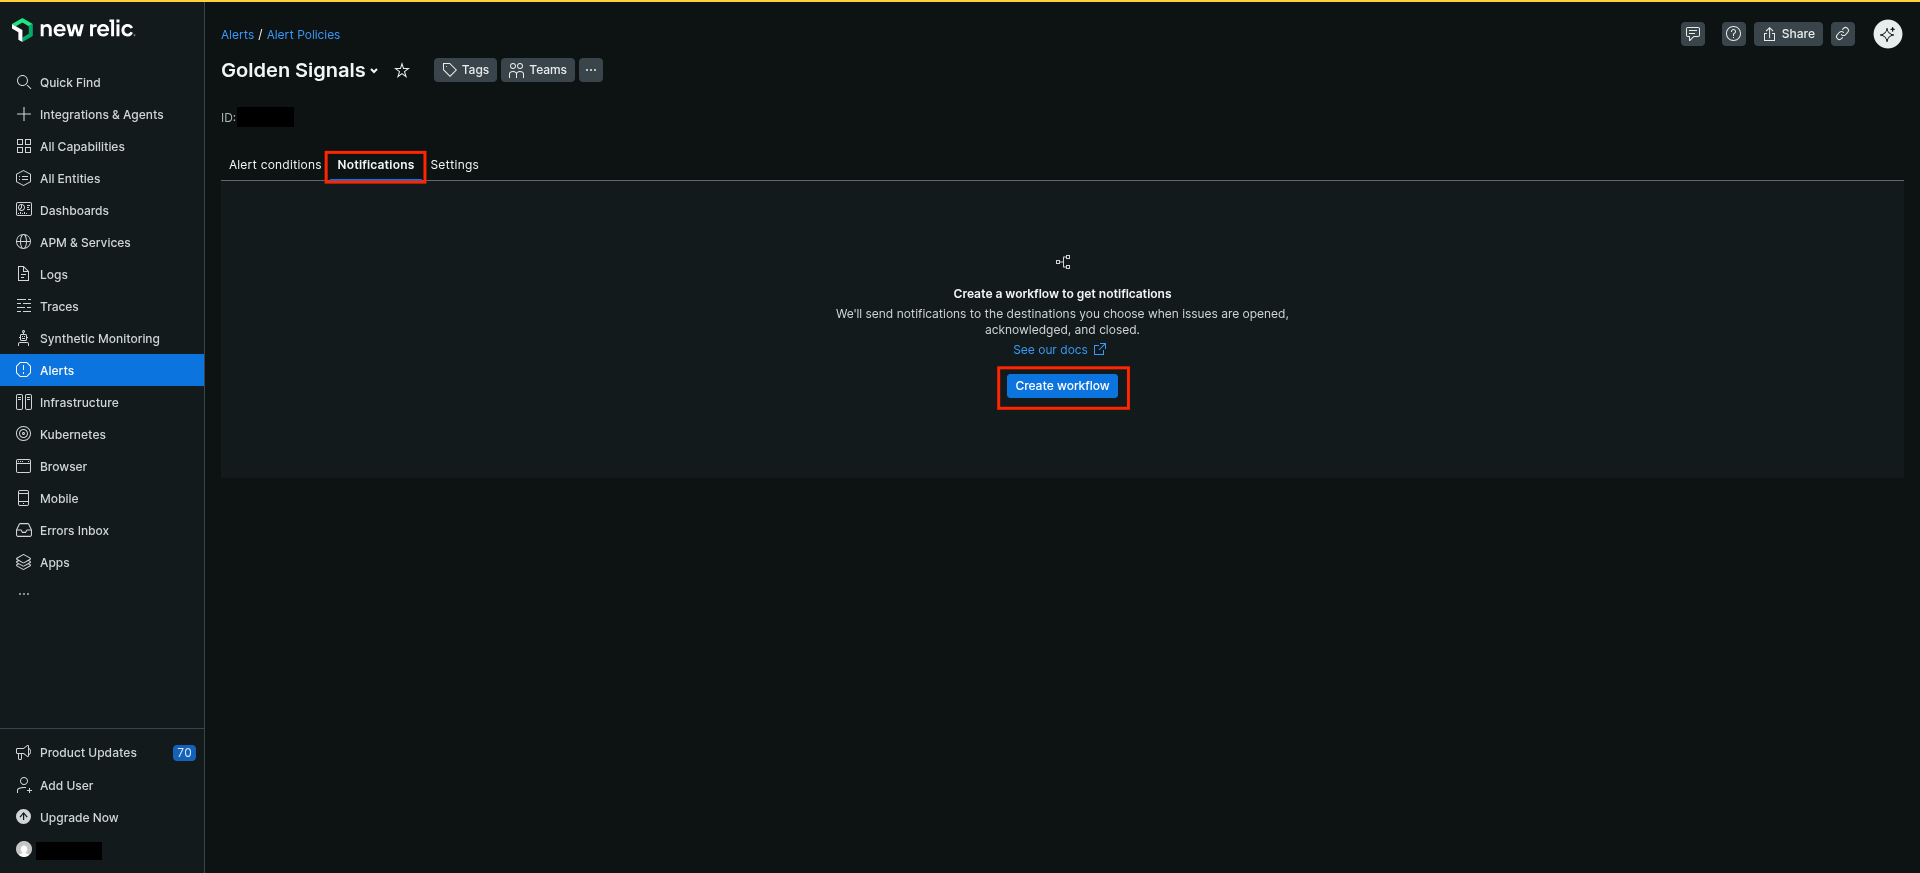
In case of a workflow already exists and you cannot create a new one, edit the existing workflow and add a Webhook additional channel
-
Type a name for the new workflow (e.g
Forward Alerts to Sekoia.io) - Enable
Enable workflowtoggle -
Click
Webhook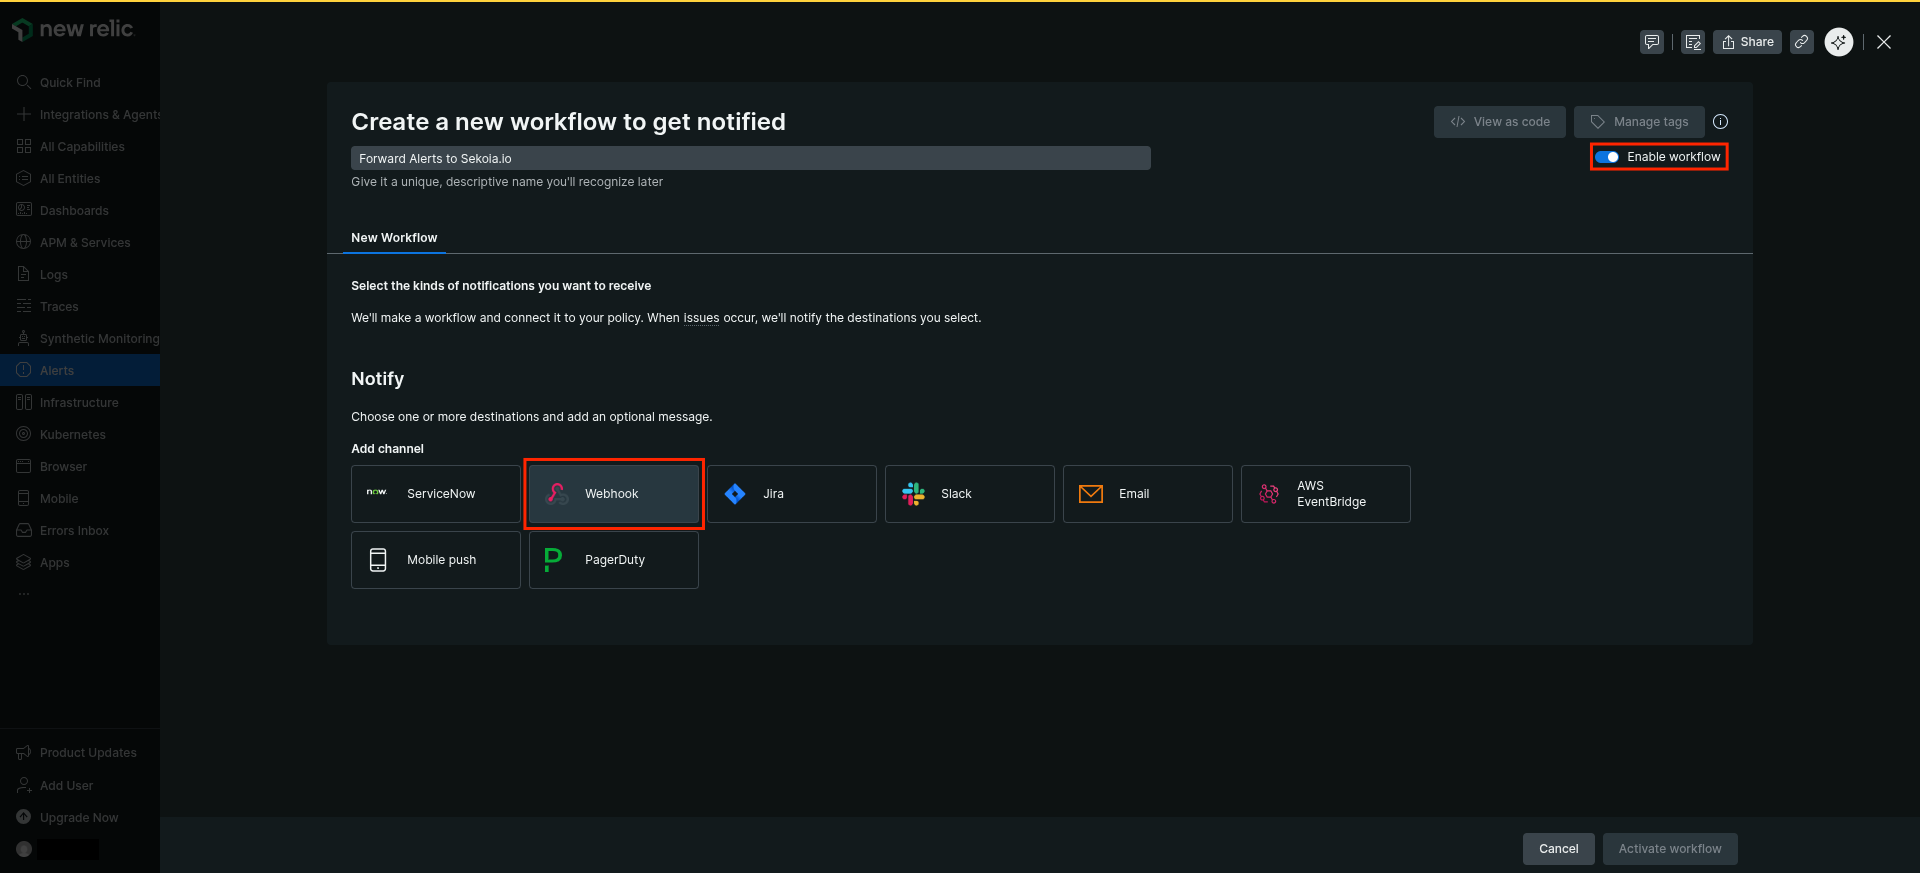
-
Type a name for the notification message (e.g
SekoiaForwardingAlerts) -
Paste the following template (default one)
{ "id": {{ json issueId }}, "issueUrl": {{ json issuePageUrl }}, "title": {{ json annotations.title.[0] }}, "priority": {{ json priority }}, "impactedEntities": {{json entitiesData.names}}, "totalIncidents": {{json totalIncidents}}, "state": {{ json state }}, "trigger": {{ json triggerEvent }}, "isCorrelated": {{ json isCorrelated }}, "createdAt": {{ createdAt }}, "updatedAt": {{ updatedAt }}, "sources": {{ json accumulations.source }}, "alertPolicyNames": {{ json accumulations.policyName }}, "alertConditionNames": {{ json accumulations.conditionName }}, "workflowName": {{ json workflowName }} } -
Click
Send test notificationand check you intake to validate the correct configuration of the forwarding -
Click
Save message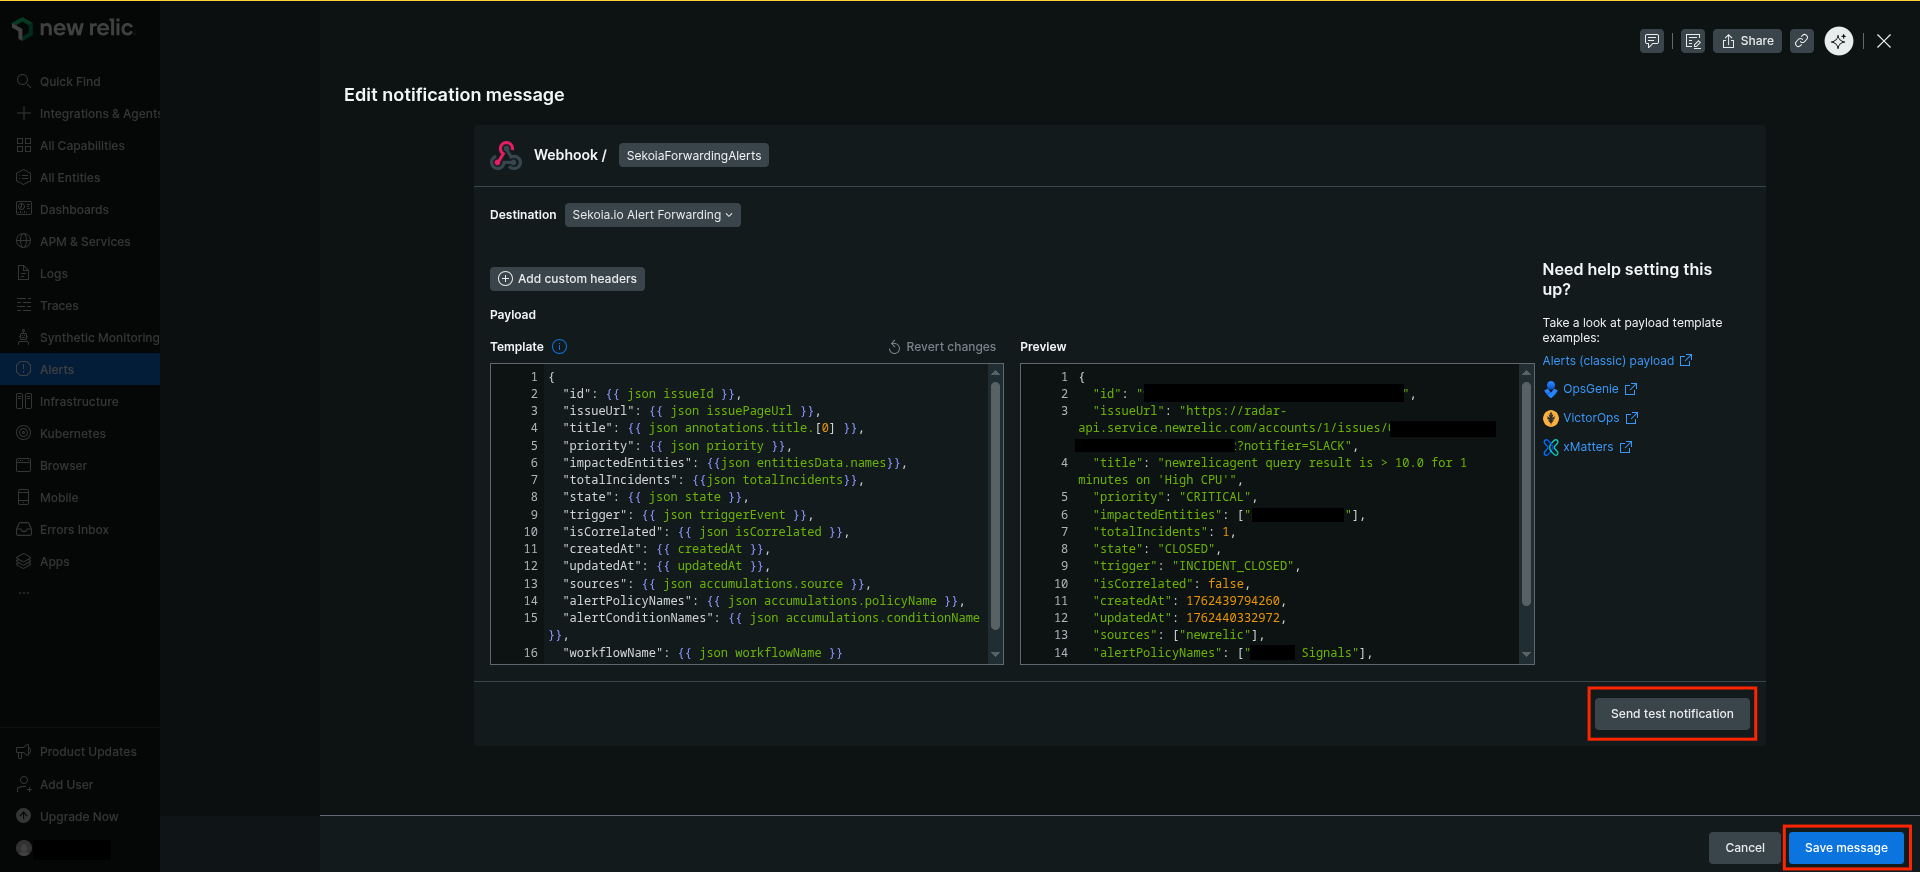
-
Click the menu on the right of the Webhook destination
- Disable all triggers except
Activated -
Click
Activate Workflow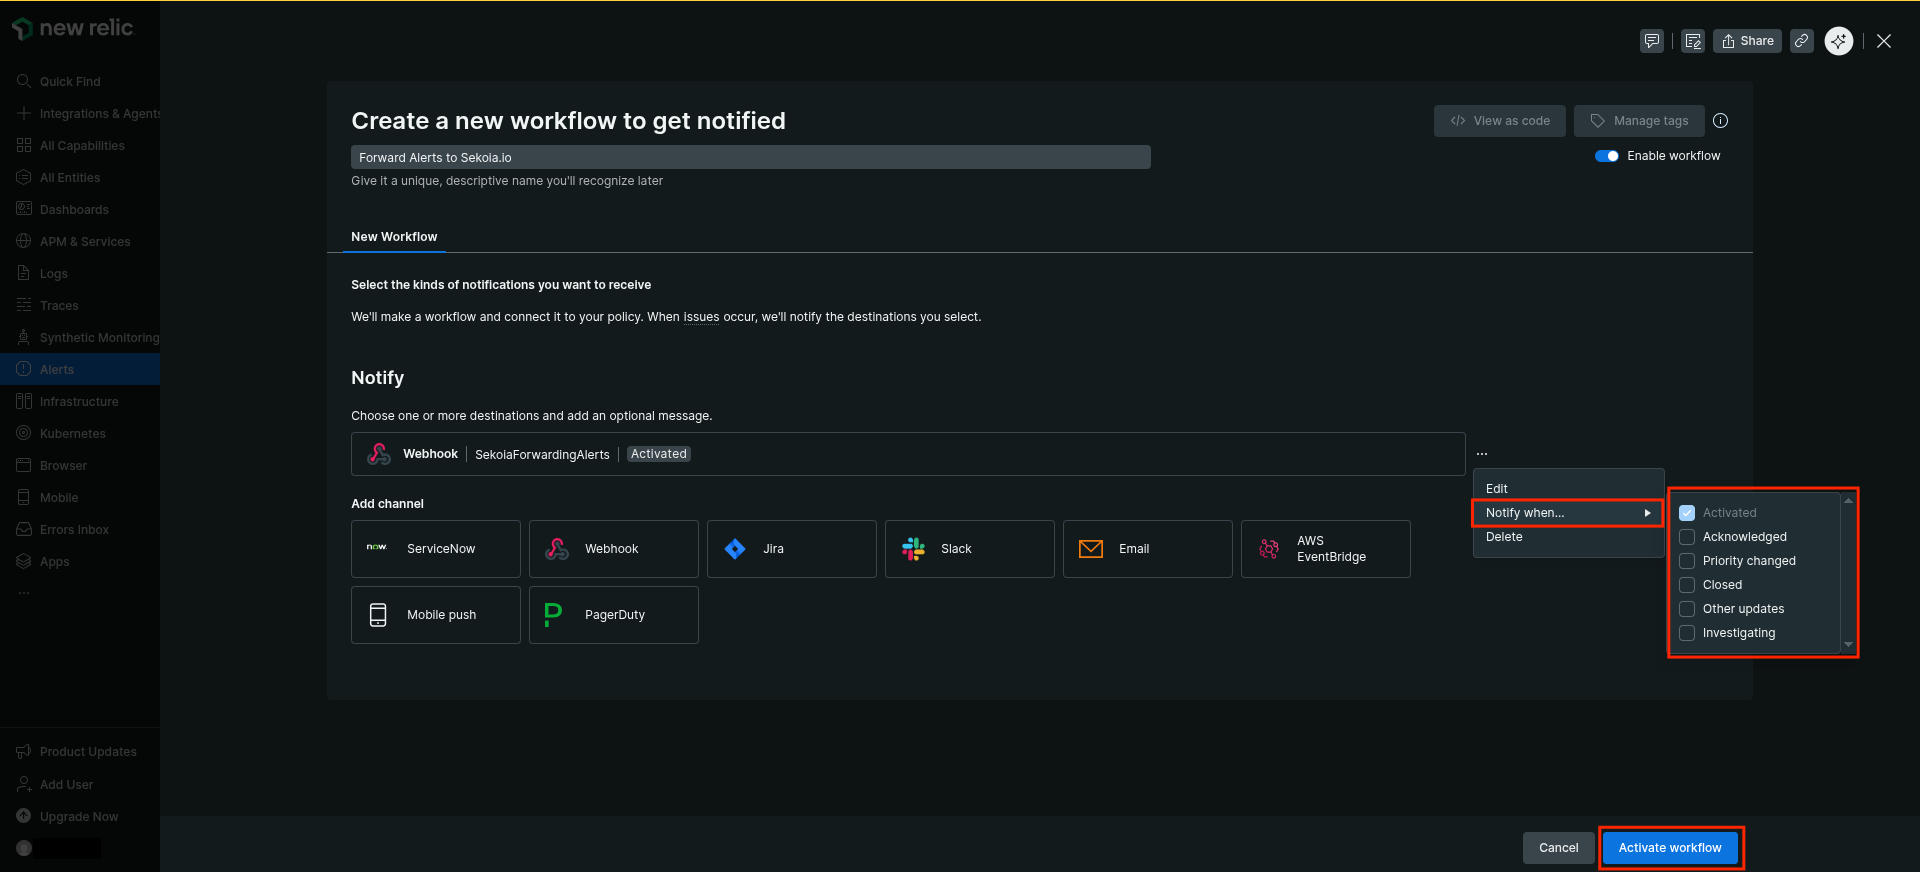
Raw Events Samples
In this section, you will find examples of raw logs as generated natively by the source. These examples are provided to help integrators understand the data format before ingestion into Sekoia.io. It is crucial for setting up the correct parsing stages and ensuring that all relevant information is captured.
{
    "id": "00000000-0000-0000-0000-000000000000",
    "issueUrl": "https://radar-api.service.eu.example.com/accounts/1111111/issues/00000000-0000-0000-0000-000000000000?notifier=WEBHOOK",
    "title": "newrelicagent query result is > 10.0 for 1 minutes on 'High CPU'",
    "priority": "CRITICAL",
    "impactedEntities": [
        "hostname"
    ],
    "totalIncidents": "1",
    "state": "ACTIVATED",
    "trigger": "STATE_CHANGE",
    "isCorrelated": "false",
    "createdAt": 1762515388769,
    "updatedAt": 1762515388770,
    "sources": [
        "newrelic"
    ],
    "alertPolicyNames": [
        "MyPolicy"
    ],
    "alertConditionNames": [
        "MyAlertCondition"
    ],
    "workflowName": "Forward Alerts to Sekoia.io"
}
Detection section
The following section provides information for those who wish to learn more about the detection capabilities enabled by collecting this intake. It includes details about the built-in rule catalog, event categories, and ECS fields extracted from raw events. This is essential for users aiming to create custom detection rules, perform hunting activities, or pivot in the events page.
No related built-in rules was found. This message is automatically generated.
Event Categories
The following table lists the data source offered by this integration.
| Data Source | Description |
|---|---|
Application logs |
None |
In details, the following table denotes the type of events produced by this integration.
| Name | Values |
|---|---|
| Kind | alert |
| Category | intrusion_detection |
| Type | info |
Transformed Events Samples after Ingestion
This section demonstrates how the raw logs will be transformed by our parsers. It shows the extracted fields that will be available for use in the built-in detection rules and hunting activities in the events page. Understanding these transformations is essential for analysts to create effective detection mechanisms with custom detection rules and to leverage the full potential of the collected data.
{
    "message": "{\"id\": \"00000000-0000-0000-0000-000000000000\", \"issueUrl\": \"https://radar-api.service.eu.example.com/accounts/1111111/issues/00000000-0000-0000-0000-000000000000?notifier=WEBHOOK\", \"title\": \"newrelicagent query result is > 10.0 for 1 minutes on 'High CPU'\", \"priority\": \"CRITICAL\", \"impactedEntities\": [\"hostname\"], \"totalIncidents\": \"1\", \"state\": \"ACTIVATED\", \"trigger\": \"STATE_CHANGE\", \"isCorrelated\": \"false\", \"createdAt\": 1762515388769, \"updatedAt\": 1762515388770, \"sources\": [\"newrelic\"], \"alertPolicyNames\": [\"MyPolicy\"], \"alertConditionNames\": [\"MyAlertCondition\"], \"workflowName\": \"Forward Alerts to Sekoia.io\"}",
    "event": {
        "category": [
            "intrusion_detection"
        ],
        "dataset": "newrelic.alerts",
        "kind": "alert",
        "provider": "newrelic",
        "reason": "newrelicagent query result is > 10.0 for 1 minutes on 'High CPU'",
        "type": [
            "info"
        ],
        "url": "https://radar-api.service.eu.example.com/accounts/1111111/issues/00000000-0000-0000-0000-000000000000?notifier=WEBHOOK"
    },
    "@timestamp": "2025-11-07T11:36:28.769000Z",
    "log": {
        "level": "CRITICAL"
    },
    "newrelic": {
        "alert": {
            "conditions": [
                "MyAlertCondition"
            ],
            "id": "00000000-0000-0000-0000-000000000000",
            "impacted_entities": [
                "hostname"
            ],
            "is_correlated": false,
            "state": "ACTIVATED",
            "total_incidents": 1,
            "trigger": "STATE_CHANGE"
        }
    },
    "rule": {
        "name": "MyPolicy"
    }
}
Extracted Fields
The following table lists the fields that are extracted, normalized under the ECS format, analyzed and indexed by the parser. It should be noted that infered fields are not listed.
| Name | Type | Description |
|---|---|---|
@timestamp |
date |
Date/time when the event originated. |
event.category |
keyword |
Event category. The second categorization field in the hierarchy. |
event.dataset |
keyword |
Name of the dataset. |
event.kind |
keyword |
The kind of the event. The highest categorization field in the hierarchy. |
event.provider |
keyword |
Source of the event. |
event.reason |
keyword |
Reason why this event happened, according to the source |
event.type |
keyword |
Event type. The third categorization field in the hierarchy. |
event.url |
keyword |
Event investigation URL |
log.level |
keyword |
Log level of the log event. |
newrelic.alert.conditions |
keyword |
|
newrelic.alert.id |
keyword |
|
newrelic.alert.impacted_entities |
array |
|
newrelic.alert.is_correlated |
boolean |
|
newrelic.alert.state |
keyword |
|
newrelic.alert.total_incidents |
long |
|
newrelic.alert.trigger |
keyword |
|
rule.name |
keyword |
Rule name |
For more information on the Intake Format, please find the code of the Parser, Smart Descriptions, and Supported Events here.