Azure Network Watcher (Virtual Network Flow Logs)
Overview
Azure Network Watcher provide insights into the traffic flowing within and out of your Azure Virtual Network. Virtual Network flow logs capture detailed information about allowed and denied network traffic, helping to enhance security and network monitoring. Sending flow logs to Sekoia.io will allow you to detect threats from the IP traffic, thanks to daily contextualized and actionable cyber threat indicators.
- Vendor: Microsoft Azure
- Supported environment: SaaS
- Detection based on: Telemetry
- Supported application or feature: Host network interface, Netflow/Enclave netflow, Network device logs, Network protocol analysis
Configure
Register Insights provider
- Log into Azure console
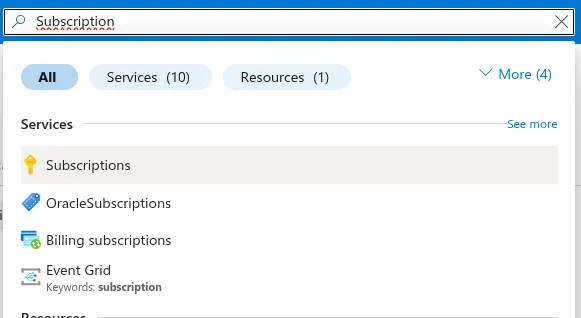
- In the search bar, enter
Subscriptions
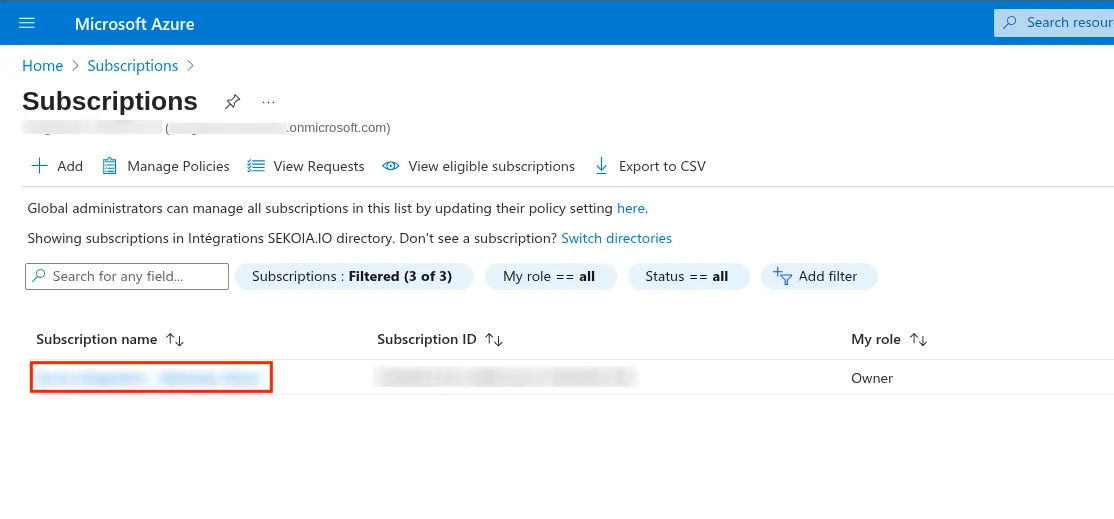
- Click your subscription
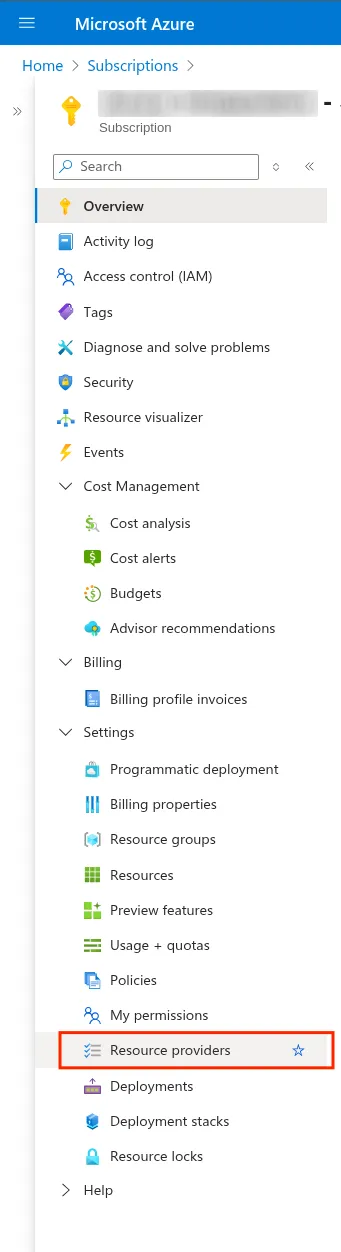
- On the left panel, go to
Settings>Resource providers
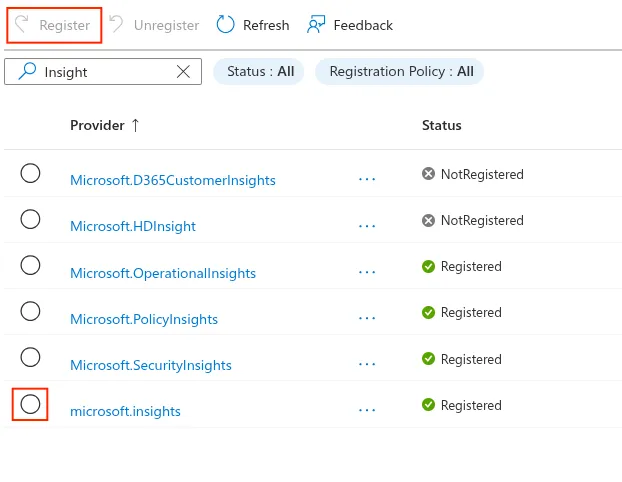
- Search the Insight providers, select
microsoft.insightsand clickRegister
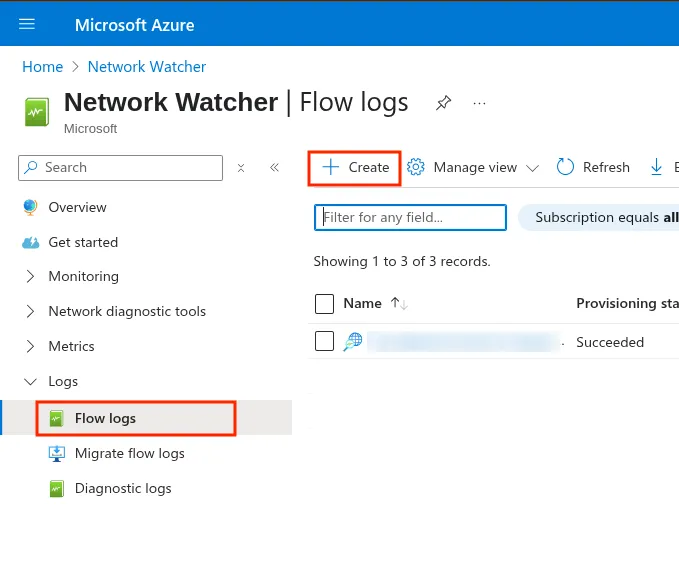
Create a new flow log
- Go to
Network Watcher - On the left panel, go to
Logs>Flow Logs - Click
+ Create
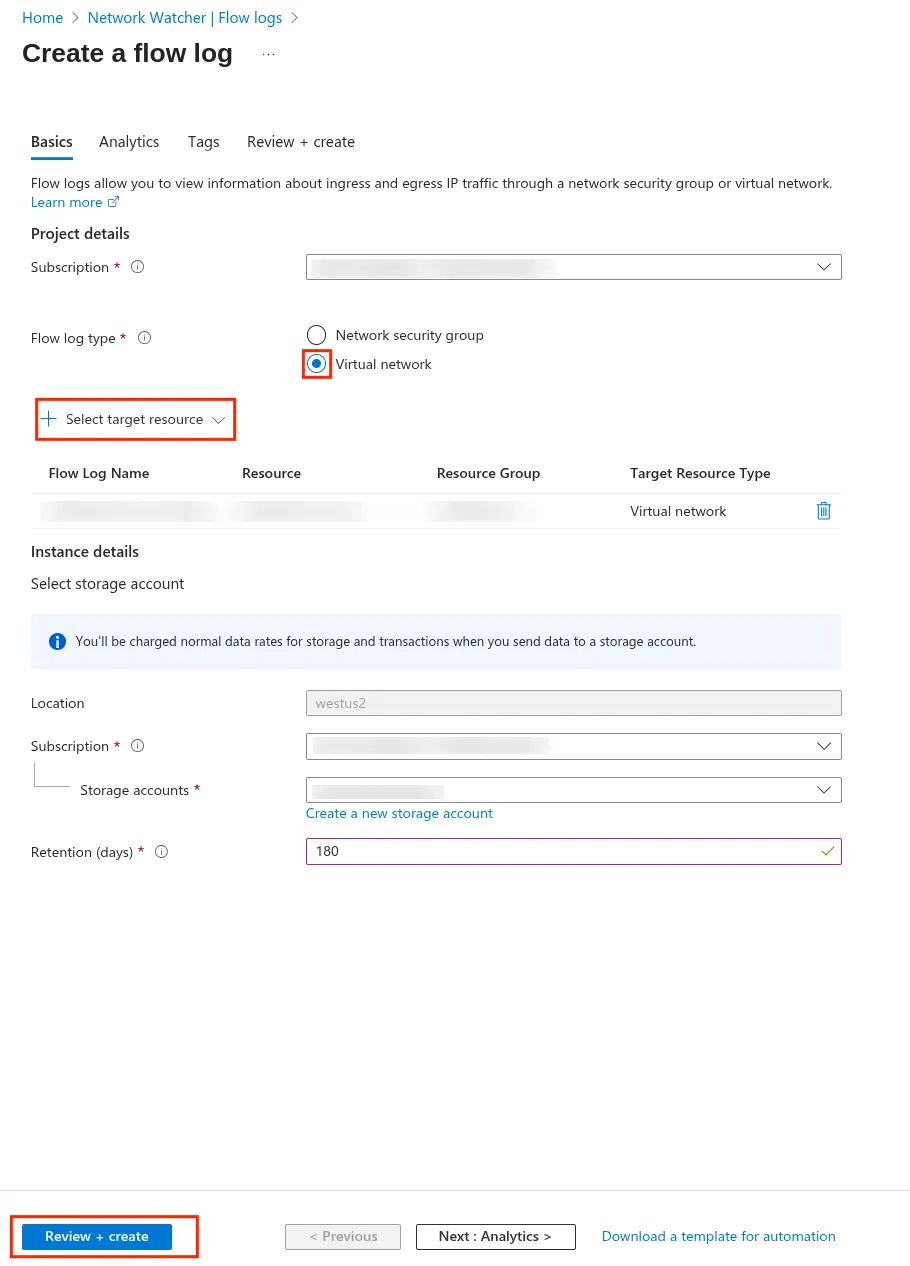
- Select the subscription to associate to the flow log
- Select
Virtual networkas the Flow log type - Select a target resource
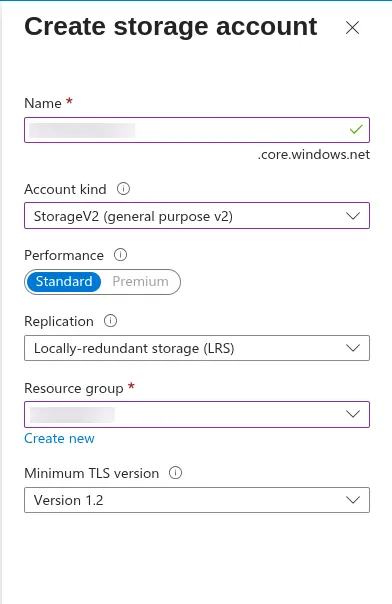
- Select a existing storage account or create a new one. If you need to create a new storage account, we recommend creating a StorageV2 account kind.
- Enter a retention period for the logs
- Click
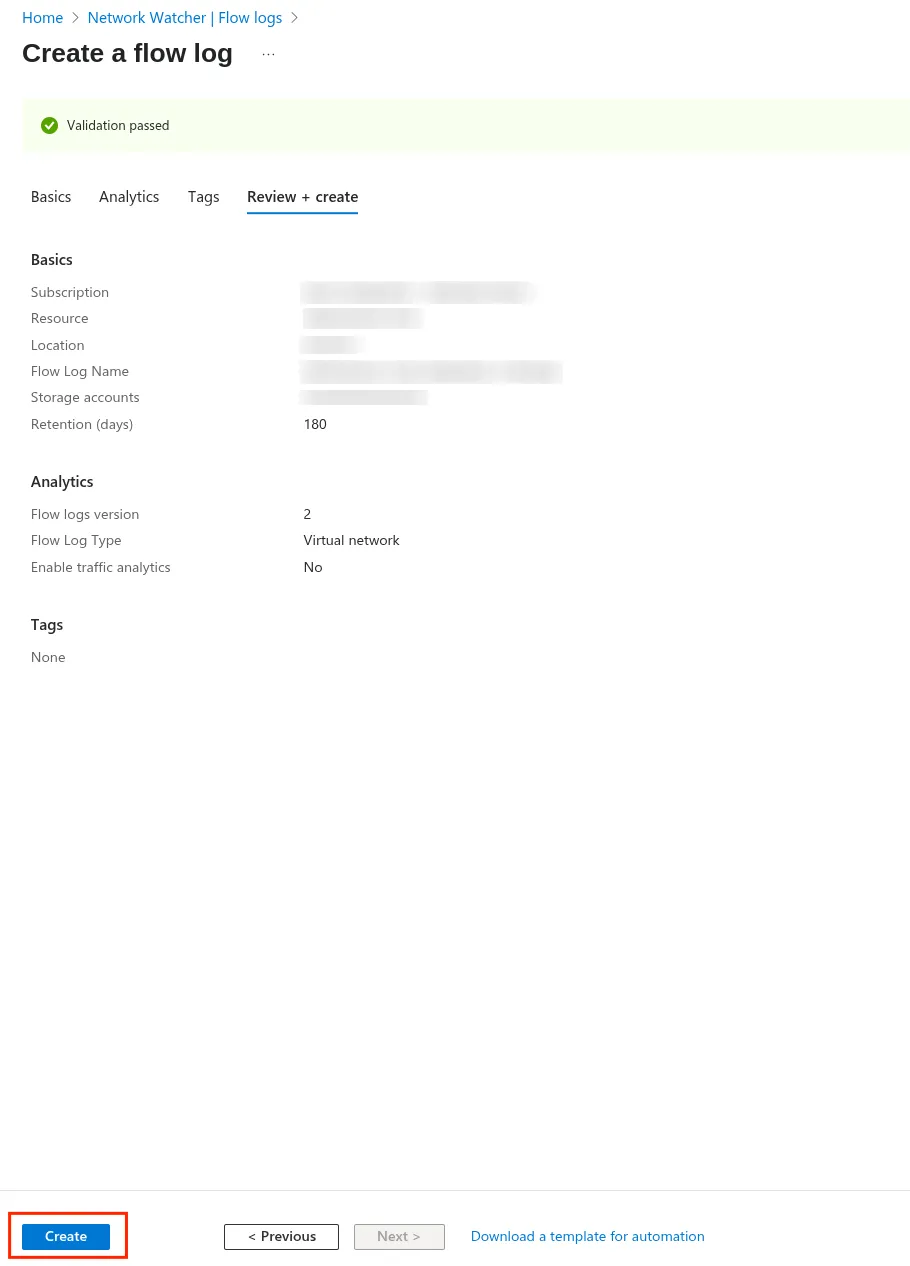
Review + create
- In the review, Click
Create
Get the credentials
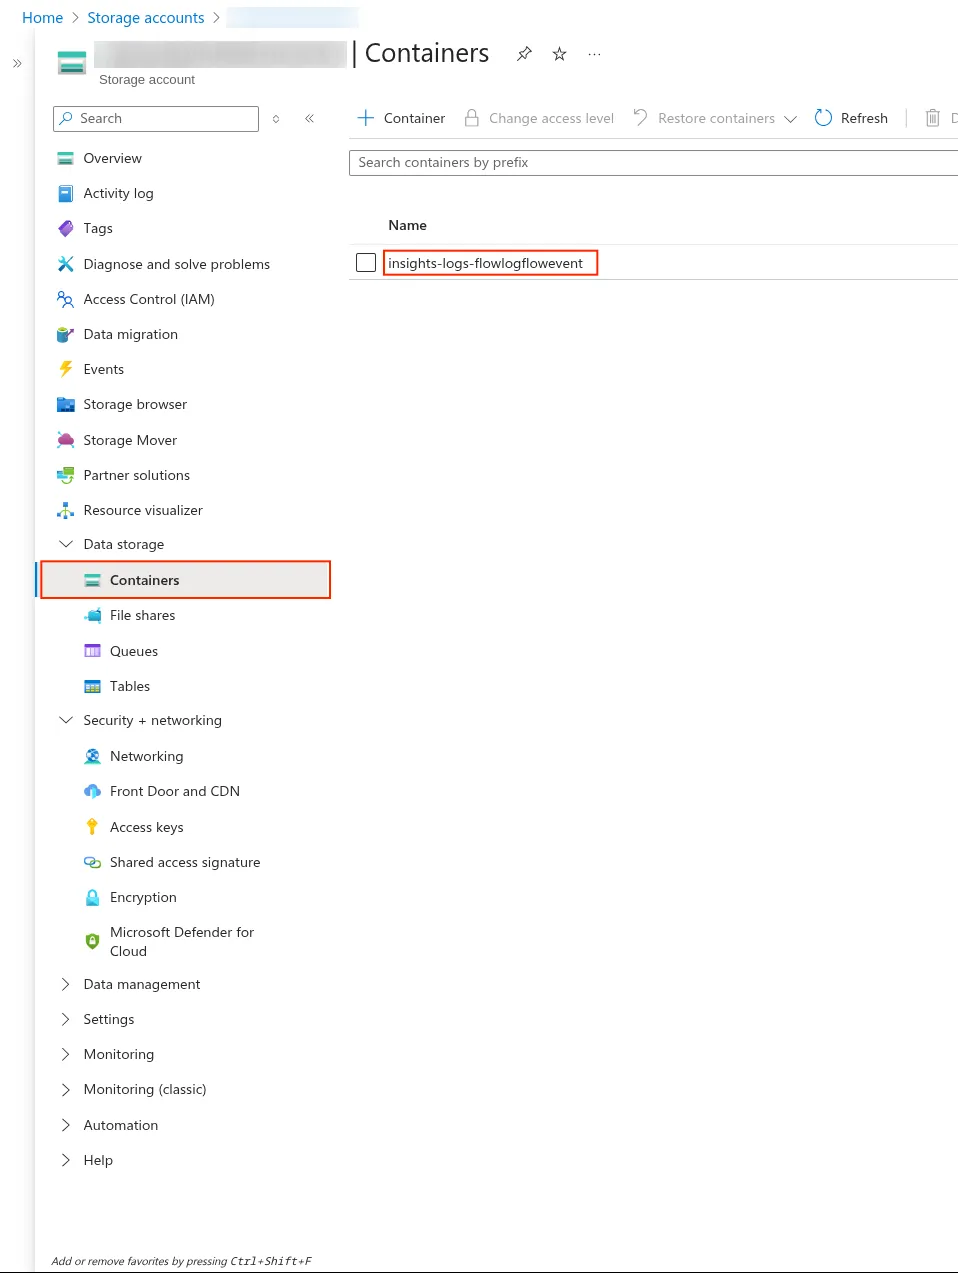
- Go to your storage account
- Go to
Data storage>containerand copy the name of your new container (insight-logs-flowlogflowevent)
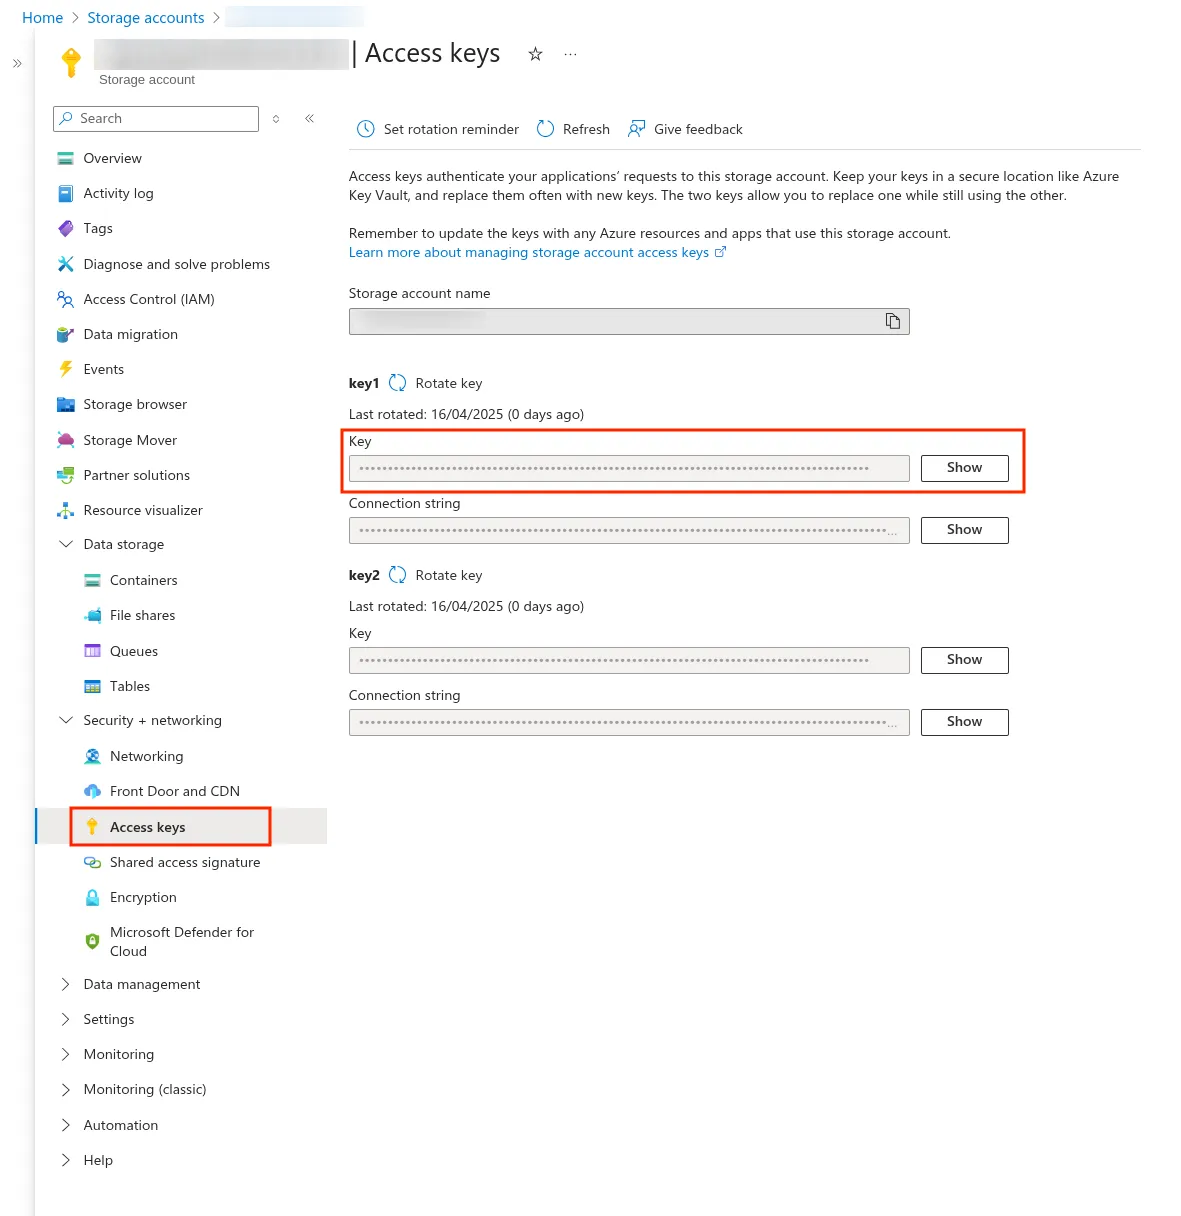
- Go to
Data storage>Access Key - Copy the storage account name and the key
Create the intake
Go to the intake page and create a new intake from the format Azure Network Watcher Flow Logs.
Raw Events Samples
In this section, you will find examples of raw logs as generated natively by the source. These examples are provided to help integrators understand the data format before ingestion into Sekoia.io. It is crucial for setting up the correct parsing stages and ensuring that all relevant information is captured.
{
    "time": "2025-04-30T09:07:40.986182+00:00",
    "flowLogVersion": 4,
    "flowLogGUID": "flowLogGUID1",
    "macAddress": "112233445566",
    "operationName": "FlowLogFlowEvent",
    "aclID": "aclID1",
    "rule": "DefaultRule_AllowInternetOutBound",
    "flow.0": "1663146003599,1.2.3.4,192.0.2.180,23956,443,6,O,B,NX,0,0,0,0"
}
{
    "time": "2025-04-30T09:07:40.986182+00:00",
    "flowLogVersion": 4,
    "flowLogGUID": "flowLogGUID1",
    "macAddress": "112233445566",
    "operationName": "FlowLogFlowEvent",
    "aclID": "aclID1",
    "rule": "DefaultRule_AllowInternetOutBound",
    "flow.0": "1663146003606,1.2.3.4,192.0.2.180,23956,443,6,O,E,NX,3,767,2,1580"
}
{
    "time": "2025-04-30T09:07:40.986182+00:00",
    "flowLogVersion": 4,
    "flowLogGUID": "flowLogGUID1",
    "macAddress": "112233445566",
    "operationName": "FlowLogFlowEvent",
    "aclID": "aclID2",
    "rule": "BlockHighRiskTCPPortsFromInternet",
    "flow.0": "1663145998065,8.7.6.5,1.2.3.4,55188,22,6,I,D,NX,0,0,0,0"
}
{
    "time": "2025-04-30T09:07:40.986182+00:00",
    "flowLogVersion": 4,
    "flowLogGUID": "flowLogGUID1",
    "macAddress": "112233445566",
    "operationName": "FlowLogFlowEvent",
    "aclID": "aclID2",
    "rule": "BlockHighRiskTCPPortsFromInternet",
    "flow.0": "1663146005503,2.3.4.5,1.2.3.4,35276,119,6,I,D,NX,0,0,0,0"
}
{
    "time": "2025-04-30T09:07:40.986182+00:00",
    "flowLogVersion": 4,
    "flowLogGUID": "flowLogGUID1",
    "macAddress": "112233445566",
    "operationName": "FlowLogFlowEvent",
    "aclID": "aclID2",
    "rule": "Internet",
    "flow.0": "1663145989563,3.4.5.6,1.2.3.4,50557,44357,6,I,D,NX,0,0,0,0"
}
{
    "time": "2025-04-30T09:07:40.986182+00:00",
    "flowLogVersion": 4,
    "flowLogGUID": "flowLogGUID1",
    "macAddress": "112233445566",
    "operationName": "FlowLogFlowEvent",
    "aclID": "aclID2",
    "rule": "Internet",
    "flow.0": "1663145989679,1.2.3.81,1.2.3.4,62797,35945,6,I,D,NX,0,0,0,0"
}
Detection section
The following section provides information for those who wish to learn more about the detection capabilities enabled by collecting this intake. It includes details about the built-in rule catalog, event categories, and ECS fields extracted from raw events. This is essential for users aiming to create custom detection rules, perform hunting activities, or pivot in the events page.
Related Built-in Rules
The following Sekoia.io built-in rules match the intake Azure Network Watcher Flow Logs. This documentation is updated automatically and is based solely on the fields used by the intake which are checked against our rules. This means that some rules will be listed but might not be relevant with the intake.
SEKOIA.IO x Azure Network Watcher Flow Logs on ATT&CK Navigator
Account Added To A Security Enabled Group
Detection in order to investigate who has added a specific Domain User in Domain Admins or Group Policy Creator Owners (Security event 4728)
- Effort: master
Account Removed From A Security Enabled Group
Detection in order to investigate who has removed a specific Domain User in Domain Admins or Group Policy Creator Owners (Security event 4729)
- Effort: master
Computer Account Deleted
Detects computer account deletion.
- Effort: master
Cryptomining
Detection of domain names potentially related to cryptomining activities.
- Effort: master
Domain Trust Created Or Removed
A trust was created or removed to a domain. An attacker could perform that in order to do lateral movement easily between domains or shutdown the ability of two domains to communicate.
- Effort: advanced
Dynamic DNS Contacted
Detect communication with dynamic dns domain. This kind of domain is often used by attackers. This rule can trigger false positive in non-controlled environment because dynamic dns is not always malicious.
- Effort: master
Exfiltration Domain
Detects traffic toward a domain flagged as a possible exfiltration vector.
- Effort: master
Password Change On Directory Service Restore Mode (DSRM) Account
The Directory Service Restore Mode (DSRM) account is a local administrator account on Domain Controllers. Attackers may change the password to gain persistence.
- Effort: intermediate
Possible Replay Attack
This event can be a sign of Kerberos replay attack or, among other things, network device configuration or routing problems.
- Effort: master
Remote Access Tool Domain
Detects traffic toward a domain flagged as a Remote Administration Tool (RAT).
- Effort: master
SEKOIA.IO Intelligence Feed
Detect threats based on indicators of compromise (IOCs) collected by SEKOIA's Threat and Detection Research team.
- Effort: elementary
Sekoia.io EICAR Detection
Detects observables in Sekoia.io CTI tagged as EICAR, which are fake samples meant to test detection.
- Effort: master
TOR Usage Generic Rule
Detects TOR usage globally, whether the IP is a destination or source. TOR is short for The Onion Router, and it gets its name from how it works. TOR intercepts the network traffic from one or more apps on user’s computer, usually the user web browser, and shuffles it through a number of randomly-chosen computers before passing it on to its destination. This disguises user location, and makes it harder for servers to pick him/her out on repeat visits, or to tie together separate visits to different sites, this making tracking and surveillance more difficult. Before a network packet starts its journey, user’s computer chooses a random list of relays and repeatedly encrypts the data in multiple layers, like an onion. Each relay knows only enough to strip off the outermost layer of encryption, before passing what’s left on to the next relay in the list.
- Effort: master
User Account Created
Detects user creation on windows servers, which shouldn't happen in an Active Directory environment. Apply this on your windows server logs and not on your DC logs. One default account defaultuser0 is excluded as only used during Windows set-up. This detection use Security Event ID 4720.
- Effort: master
User Account Deleted
Detects local user deletion
- Effort: master
Event Categories
The following table lists the data source offered by this integration.
| Data Source | Description |
|---|---|
Host network interface |
None |
Netflow/Enclave netflow |
None |
Network device logs |
None |
Network protocol analysis |
None |
In details, the following table denotes the type of events produced by this integration.
| Name | Values |
|---|---|
| Kind | `` |
| Category | network |
| Type | `` |
Transformed Events Samples after Ingestion
This section demonstrates how the raw logs will be transformed by our parsers. It shows the extracted fields that will be available for use in the built-in detection rules and hunting activities in the events page. Understanding these transformations is essential for analysts to create effective detection mechanisms with custom detection rules and to leverage the full potential of the collected data.
{
    "message": "{\"time\":\"2025-04-30T09:07:40.986182+00:00\",\"flowLogVersion\":4,\"flowLogGUID\":\"flowLogGUID1\",\"macAddress\":\"112233445566\",\"operationName\":\"FlowLogFlowEvent\",\"aclID\":\"aclID1\",\"rule\":\"DefaultRule_AllowInternetOutBound\",\"flow.0\":\"1663146003599,1.2.3.4,192.0.2.180,23956,443,6,O,B,NX,0,0,0,0\"}",
    "event": {
        "category": [
            "network"
        ],
        "code": "FlowLogFlowEvent",
        "type": [
            "start"
        ]
    },
    "@timestamp": "2022-09-14T09:00:03.599000Z",
    "action": {
        "properties": {
            "FlowEncryption": "NX",
            "OperationName": "FlowLogFlowEvent"
        },
        "target": "network-traffic"
    },
    "destination": {
        "address": "192.0.2.180",
        "bytes": 0,
        "ip": "192.0.2.180",
        "packets": 0,
        "port": 443
    },
    "network": {
        "direction": "outbound",
        "iana_number": "6"
    },
    "observer": {
        "mac": "112233445566"
    },
    "related": {
        "ip": [
            "1.2.3.4",
            "192.0.2.180"
        ]
    },
    "rule": {
        "name": "DefaultRule_AllowInternetOutBound"
    },
    "source": {
        "address": "1.2.3.4",
        "bytes": 0,
        "ip": "1.2.3.4",
        "packets": 0,
        "port": 23956
    }
}
{
    "message": "{\"time\":\"2025-04-30T09:07:40.986182+00:00\",\"flowLogVersion\":4,\"flowLogGUID\":\"flowLogGUID1\",\"macAddress\":\"112233445566\",\"operationName\":\"FlowLogFlowEvent\",\"aclID\":\"aclID1\",\"rule\":\"DefaultRule_AllowInternetOutBound\",\"flow.0\":\"1663146003606,1.2.3.4,192.0.2.180,23956,443,6,O,E,NX,3,767,2,1580\"}",
    "event": {
        "category": [
            "network"
        ],
        "code": "FlowLogFlowEvent",
        "type": [
            "end"
        ]
    },
    "@timestamp": "2022-09-14T09:00:03.606000Z",
    "action": {
        "properties": {
            "FlowEncryption": "NX",
            "OperationName": "FlowLogFlowEvent"
        },
        "target": "network-traffic"
    },
    "destination": {
        "address": "192.0.2.180",
        "bytes": 1580,
        "ip": "192.0.2.180",
        "packets": 2,
        "port": 443
    },
    "network": {
        "direction": "outbound",
        "iana_number": "6"
    },
    "observer": {
        "mac": "112233445566"
    },
    "related": {
        "ip": [
            "1.2.3.4",
            "192.0.2.180"
        ]
    },
    "rule": {
        "name": "DefaultRule_AllowInternetOutBound"
    },
    "source": {
        "address": "1.2.3.4",
        "bytes": 767,
        "ip": "1.2.3.4",
        "packets": 3,
        "port": 23956
    }
}
{
    "message": "{\"time\":\"2025-04-30T09:07:40.986182+00:00\",\"flowLogVersion\":4,\"flowLogGUID\":\"flowLogGUID1\",\"macAddress\":\"112233445566\",\"operationName\":\"FlowLogFlowEvent\",\"aclID\":\"aclID2\",\"rule\":\"BlockHighRiskTCPPortsFromInternet\",\"flow.0\":\"1663145998065,8.7.6.5,1.2.3.4,55188,22,6,I,D,NX,0,0,0,0\"}",
    "event": {
        "category": [
            "network"
        ],
        "code": "FlowLogFlowEvent",
        "type": [
            "denied"
        ]
    },
    "@timestamp": "2022-09-14T08:59:58.065000Z",
    "action": {
        "properties": {
            "FlowEncryption": "NX",
            "OperationName": "FlowLogFlowEvent"
        },
        "target": "network-traffic"
    },
    "destination": {
        "address": "1.2.3.4",
        "bytes": 0,
        "ip": "1.2.3.4",
        "packets": 0,
        "port": 22
    },
    "network": {
        "direction": "inbound",
        "iana_number": "6"
    },
    "observer": {
        "mac": "112233445566"
    },
    "related": {
        "ip": [
            "1.2.3.4",
            "8.7.6.5"
        ]
    },
    "rule": {
        "name": "BlockHighRiskTCPPortsFromInternet"
    },
    "source": {
        "address": "8.7.6.5",
        "bytes": 0,
        "ip": "8.7.6.5",
        "packets": 0,
        "port": 55188
    }
}
{
    "message": "{\"time\":\"2025-04-30T09:07:40.986182+00:00\",\"flowLogVersion\":4,\"flowLogGUID\":\"flowLogGUID1\",\"macAddress\":\"112233445566\",\"operationName\":\"FlowLogFlowEvent\",\"aclID\":\"aclID2\",\"rule\":\"BlockHighRiskTCPPortsFromInternet\",\"flow.0\":\"1663146005503,2.3.4.5,1.2.3.4,35276,119,6,I,D,NX,0,0,0,0\"}",
    "event": {
        "category": [
            "network"
        ],
        "code": "FlowLogFlowEvent",
        "type": [
            "denied"
        ]
    },
    "@timestamp": "2022-09-14T09:00:05.503000Z",
    "action": {
        "properties": {
            "FlowEncryption": "NX",
            "OperationName": "FlowLogFlowEvent"
        },
        "target": "network-traffic"
    },
    "destination": {
        "address": "1.2.3.4",
        "bytes": 0,
        "ip": "1.2.3.4",
        "packets": 0,
        "port": 119
    },
    "network": {
        "direction": "inbound",
        "iana_number": "6"
    },
    "observer": {
        "mac": "112233445566"
    },
    "related": {
        "ip": [
            "1.2.3.4",
            "2.3.4.5"
        ]
    },
    "rule": {
        "name": "BlockHighRiskTCPPortsFromInternet"
    },
    "source": {
        "address": "2.3.4.5",
        "bytes": 0,
        "ip": "2.3.4.5",
        "packets": 0,
        "port": 35276
    }
}
{
    "message": "{\"time\":\"2025-04-30T09:07:40.986182+00:00\",\"flowLogVersion\":4,\"flowLogGUID\":\"flowLogGUID1\",\"macAddress\":\"112233445566\",\"operationName\":\"FlowLogFlowEvent\",\"aclID\":\"aclID2\",\"rule\":\"Internet\",\"flow.0\":\"1663145989563,3.4.5.6,1.2.3.4,50557,44357,6,I,D,NX,0,0,0,0\"}",
    "event": {
        "category": [
            "network"
        ],
        "code": "FlowLogFlowEvent",
        "type": [
            "denied"
        ]
    },
    "@timestamp": "2022-09-14T08:59:49.563000Z",
    "action": {
        "properties": {
            "FlowEncryption": "NX",
            "OperationName": "FlowLogFlowEvent"
        },
        "target": "network-traffic"
    },
    "destination": {
        "address": "1.2.3.4",
        "bytes": 0,
        "ip": "1.2.3.4",
        "packets": 0,
        "port": 44357
    },
    "network": {
        "direction": "inbound",
        "iana_number": "6"
    },
    "observer": {
        "mac": "112233445566"
    },
    "related": {
        "ip": [
            "1.2.3.4",
            "3.4.5.6"
        ]
    },
    "rule": {
        "name": "Internet"
    },
    "source": {
        "address": "3.4.5.6",
        "bytes": 0,
        "ip": "3.4.5.6",
        "packets": 0,
        "port": 50557
    }
}
{
    "message": "{\"time\":\"2025-04-30T09:07:40.986182+00:00\",\"flowLogVersion\":4,\"flowLogGUID\":\"flowLogGUID1\",\"macAddress\":\"112233445566\",\"operationName\":\"FlowLogFlowEvent\",\"aclID\":\"aclID2\",\"rule\":\"Internet\",\"flow.0\":\"1663145989679,1.2.3.81,1.2.3.4,62797,35945,6,I,D,NX,0,0,0,0\"}",
    "event": {
        "category": [
            "network"
        ],
        "code": "FlowLogFlowEvent",
        "type": [
            "denied"
        ]
    },
    "@timestamp": "2022-09-14T08:59:49.679000Z",
    "action": {
        "properties": {
            "FlowEncryption": "NX",
            "OperationName": "FlowLogFlowEvent"
        },
        "target": "network-traffic"
    },
    "destination": {
        "address": "1.2.3.4",
        "bytes": 0,
        "ip": "1.2.3.4",
        "packets": 0,
        "port": 35945
    },
    "network": {
        "direction": "inbound",
        "iana_number": "6"
    },
    "observer": {
        "mac": "112233445566"
    },
    "related": {
        "ip": [
            "1.2.3.4",
            "1.2.3.81"
        ]
    },
    "rule": {
        "name": "Internet"
    },
    "source": {
        "address": "1.2.3.81",
        "bytes": 0,
        "ip": "1.2.3.81",
        "packets": 0,
        "port": 62797
    }
}
Extracted Fields
The following table lists the fields that are extracted, normalized under the ECS format, analyzed and indexed by the parser. It should be noted that infered fields are not listed.
| Name | Type | Description |
|---|---|---|
@timestamp |
date |
Date/time when the event originated. |
action.properties.FlowEncryption |
keyword |
|
action.properties.OperationName |
keyword |
|
action.target |
keyword |
|
destination.bytes |
long |
Bytes sent from the destination to the source. |
destination.ip |
ip |
IP address of the destination. |
destination.packets |
long |
Packets sent from the destination to the source. |
destination.port |
long |
Port of the destination. |
event.category |
keyword |
Event category. The second categorization field in the hierarchy. |
event.code |
keyword |
Identification code for this event. |
network.iana_number |
keyword |
IANA Protocol Number. |
observer.mac |
keyword |
MAC addresses of the observer. |
rule.name |
keyword |
Rule name |
source.bytes |
long |
Bytes sent from the source to the destination. |
source.ip |
ip |
IP address of the source. |
source.packets |
long |
Packets sent from the source to the destination. |
source.port |
long |
Port of the source. |
For more information on the Intake Format, please find the code of the Parser, Smart Descriptions, and Supported Events here.