Office 365 Message Trace (Graph API)
Overview
Microsoft 365 Message trace follows email messages as they travel through your Exchange Online organization. You can determine if a message was received, rejected, deferred, or delivered by the service. It also shows what actions were taken on the message before it reached its final status. You can use the information from message trace to efficiently answer user questions about what happened to messages, troubleshoot mail flow issues, and validate policy changes (More information on microsoft.com).
Warning
Important note - This format is currently in beta. We highly value your feedback to improve its performance.
- Vendor: Microsoft
- Supported environment: Cloud
- Version compatibility:
- Detection based on: Telemetry
- Supported application or feature:
Prerequisite
According to docs.microsoft.com, Message Trace is available to the following plans :
- Exchange Online Protection
- Microsoft Defender for Office 365 plan 1 and plan 2
- Microsoft 365 Defender
Configure
Provision the Microsoft application
In order to access message traces in the Microsoft Graph API, you must provision the Microsoft application 8bd644d1-64a1-4d4b-ae52-2e0cbf64e373.
- Log in the Azure Portal
-
Open the cloud shell

-
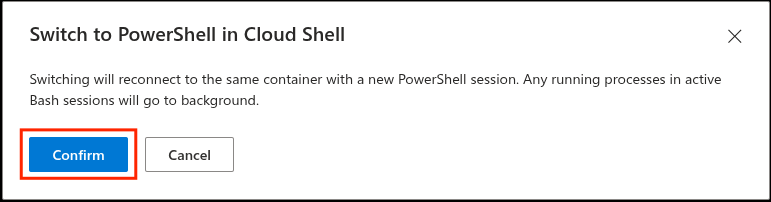
If you use the bash cloud shell, switch to the Powershell one. Click confirm in the modal.

-
Paste this command to connect to the Microsoft Graph Powershell
Connect-MgGraph -Scopes "Application.ReadWrite.All" -
Paste this command to provision the service principal
New-MgServicePrincipal -AppId 8bd644d1-64a1-4d4b-ae52-2e0cbf64e373
Configure OAuth
Collect your Tenant ID from your Azure Portal(for more information read How to find your Microsoft Entra ID (Azure AD) tenant ID).
Create an Azure application
- On the Azure Portal, in the search bar, go to
App registrations - Click
+ New registration - Type a name
- Select
Accounts in this organizational directory onlyoption as account type - Click
Register - From the
Overviewpage, copyApplication (client) IDandDirectory (tenant) ID
Create a client secret
- Go to
Manage>Certificates & secrets - Click
+ New client secret - Type a description and select the desired expiration period
- Click
Add - Copy the
Valueof the client secret
Add permissions
- Go to
Manage>API permissions - Click
Add a permission - On the right panel, Select
Microsoft APIstab - Click
Microsoft Graph - Click
Application permissions - Select the permission:
ExchangeMessageTrace.Read.All - Click
Add permissions - In the
API permissionspage, clickGrant admin consent for TENANT_NAME - Click
Yesin theGrant admin consent confirmationmodal
Create an intake
Go to your Sekoia.io Intakes page, and follow these steps:
- Click
+ Intakebutton to create a new one - Choose
Microsoft 365 Message Trace (Graph API), give it a name and choose the relevant Entity - Edit the intake configuration:
- Type the
Application (client) IDin theclient idfield - Type the
Directory (tenant) IDin thetenant idfield - Type the
Valueof the client secret in theclient secretfield
- Type the
Raw Events Samples
In this section, you will find examples of raw logs as generated natively by the source. These examples are provided to help integrators understand the data format before ingestion into Sekoia.io. It is crucial for setting up the correct parsing stages and ensuring that all relevant information is captured.
{
    "@odata.type": "#microsoft.graph.exchangeMessageTrace",
    "id": "11111111-1111-1111-1111-111111111111",
    "senderAddress": "user1@example.com",
    "recipientAddress": "user2@example.com",
    "messageId": "<22222222-2222-2222-2222-222222222222@example.com>",
    "receivedDateTime": "2025-06-13T10:30:00Z",
    "subject": "Quarterly Report",
    "size": 45678,
    "fromIP": "1.1.1.1",
    "toIP": "",
    "status": "Delivered"
}
Detection section
The following section provides information for those who wish to learn more about the detection capabilities enabled by collecting this intake. It includes details about the built-in rule catalog, event categories, and ECS fields extracted from raw events. This is essential for users aiming to create custom detection rules, perform hunting activities, or pivot in the events page.
Related Built-in Rules
The following Sekoia.io built-in rules match the intake Microsoft 365 Message Trace (Graph API). This documentation is updated automatically and is based solely on the fields used by the intake which are checked against our rules. This means that some rules will be listed but might not be relevant with the intake.
SEKOIA.IO x Microsoft 365 Message Trace (Graph API) on ATT&CK Navigator
Cryptomining
Detection of domain names potentially related to cryptomining activities.
- Effort: master
Dynamic DNS Contacted
Detect communication with dynamic dns domain. This kind of domain is often used by attackers. This rule can trigger false positive in non-controlled environment because dynamic dns is not always malicious.
- Effort: master
Exfiltration Domain
Detects traffic toward a domain flagged as a possible exfiltration vector.
- Effort: master
Remote Access Tool Domain
Detects traffic toward a domain flagged as a Remote Administration Tool (RAT).
- Effort: master
SEKOIA.IO Intelligence Feed
Detect threats based on indicators of compromise (IOCs) collected by SEKOIA's Threat and Detection Research team.
- Effort: elementary
Sekoia.io EICAR Detection
Detects observables in Sekoia.io CTI tagged as EICAR, which are fake samples meant to test detection.
- Effort: master
TOR Usage Generic Rule
Detects TOR usage globally, whether the IP is a destination or source. TOR is short for The Onion Router, and it gets its name from how it works. TOR intercepts the network traffic from one or more apps on user’s computer, usually the user web browser, and shuffles it through a number of randomly-chosen computers before passing it on to its destination. This disguises user location, and makes it harder for servers to pick him/her out on repeat visits, or to tie together separate visits to different sites, this making tracking and surveillance more difficult. Before a network packet starts its journey, user’s computer chooses a random list of relays and repeatedly encrypts the data in multiple layers, like an onion. Each relay knows only enough to strip off the outermost layer of encryption, before passing what’s left on to the next relay in the list.
- Effort: master
Event Categories
The following table lists the data source offered by this integration.
| Data Source | Description |
|---|---|
Mail server |
Message trace follows email messages as they travel through your Exchange Online organization. |
Email gateway |
Message trace follows email messages as they travel through your Exchange Online organization. |
In details, the following table denotes the type of events produced by this integration.
| Name | Values |
|---|---|
| Kind | `` |
| Category | email |
| Type | info |
Transformed Events Samples after Ingestion
This section demonstrates how the raw logs will be transformed by our parsers. It shows the extracted fields that will be available for use in the built-in detection rules and hunting activities in the events page. Understanding these transformations is essential for analysts to create effective detection mechanisms with custom detection rules and to leverage the full potential of the collected data.
{
    "message": "{\"@odata.type\": \"#microsoft.graph.exchangeMessageTrace\", \"id\": \"11111111-1111-1111-1111-111111111111\", \"senderAddress\": \"user1@example.com\", \"recipientAddress\": \"user2@example.com\", \"messageId\": \"<22222222-2222-2222-2222-222222222222@example.com>\", \"receivedDateTime\": \"2025-06-13T10:30:00Z\", \"subject\": \"Quarterly Report\", \"size\": 45678, \"fromIP\": \"1.1.1.1\", \"toIP\": \"\", \"status\": \"Delivered\"}",
    "event": {
        "action": "Delivered",
        "category": [
            "email"
        ],
        "type": [
            "info"
        ]
    },
    "@timestamp": "2025-06-13T10:30:00Z",
    "email": {
        "from": {
            "address": [
                "user1@example.com"
            ]
        },
        "message_id": "22222222-2222-2222-2222-222222222222@example.com",
        "subject": "Quarterly Report",
        "to": {
            "address": [
                "user2@example.com"
            ]
        }
    },
    "network": {
        "bytes": 45678
    },
    "related": {
        "ip": [
            "1.1.1.1"
        ]
    },
    "source": {
        "address": "1.1.1.1",
        "ip": "1.1.1.1"
    }
}
Extracted Fields
The following table lists the fields that are extracted, normalized under the ECS format, analyzed and indexed by the parser. It should be noted that infered fields are not listed.
| Name | Type | Description |
|---|---|---|
@timestamp |
date |
Date/time when the event originated. |
destination.ip |
ip |
IP address of the destination. |
email.from.address |
keyword |
The sender's email address. |
email.message_id |
wildcard |
Value from the Message-ID header. |
email.subject |
keyword |
The subject of the email message. |
email.to.address |
keyword |
Email address of recipient |
event.action |
keyword |
The action captured by the event. |
event.category |
keyword |
Event category. The second categorization field in the hierarchy. |
event.type |
keyword |
Event type. The third categorization field in the hierarchy. |
network.bytes |
long |
Total bytes transferred in both directions. |
source.ip |
ip |
IP address of the source. |
For more information on the Intake Format, please find the code of the Parser, Smart Descriptions, and Supported Events here.
Troubleshooting
App ID 8bd644d1-64a1-4d4b-ae52-2e0cbf64e373 not found
In order to retrieve Office365 MessageTrace logs, the Microsoft GraphAPI requires to provision the Microsoft application 8bd644d1-64a1-4d4b-ae52-2e0cbf64e373 as Service Principal in your tenant.
Please refer Provision the Microsoft Application.