Cases
Cases enable you to regroup your investigation findings across multiple perimeters, alerts and analysts and share your results with your end-users in an efficient manner.
You can either create a new case from an existing alert or add alerts to an existing case.
Cases listing
The listing page lists all the cases across your community. They can be listed following multiple filters:
- Status (open or closed cases)
- Assigned to or Created by
- Tags associated
You can also sort your cases depending on:
- Last edition (default)
- Creation date
- Priority (
low,medium,high)
Create a case
To create a new case, you can:
- Open the Cases page
- Click on
+ Casebutton - Provide a title and a description (mandatory fields)
- Select an assignee
- Define a priority
- Add tags if needed
- Click on
Create
Case Custom Statuses and Verdicts
Cases support the same custom status and verdict system as alerts, enabling consistent terminology and workflows across your entire SOC platform.
Custom Statuses for Cases
Custom statuses allow you to define case lifecycle stages that match your organization's investigation processes. Just like alerts, case statuses belong to one of three stages:
- Open: Cases that are active and require attention
- In progress: Cases under active investigation
- Closed: Cases that have been resolved or dismissed
Custom statuses can be configured to work exclusively for cases, exclusively for alerts, or for both simultaneously. When a status is enabled for both alerts and cases, it ensures consistent terminology across different investigation contexts.
Note
Case history preserves original status names even if a custom status is modified later. This ensures that historical records remain accurate and reflect the status names that were in use at the time of each change.
Custom Verdicts for Cases
Custom verdicts enable standardized classification of case outcomes. Each verdict belongs to either the True Positive or False Positive category, allowing your team to document investigation conclusions with precise, organization-specific terminology.
Like custom statuses, verdicts can be enabled for cases, alerts, or both, ensuring consistent language when communicating investigation outcomes.
Edit a case
To edit a case, you just have to click on a case and reach the edit button available on the details view.
The case must not have a status in the "Closed" stage in order to be edited. Cases with statuses in the "Open" or "In progress" stages can be edited.
Case details
The Case details page contains multiple elements.
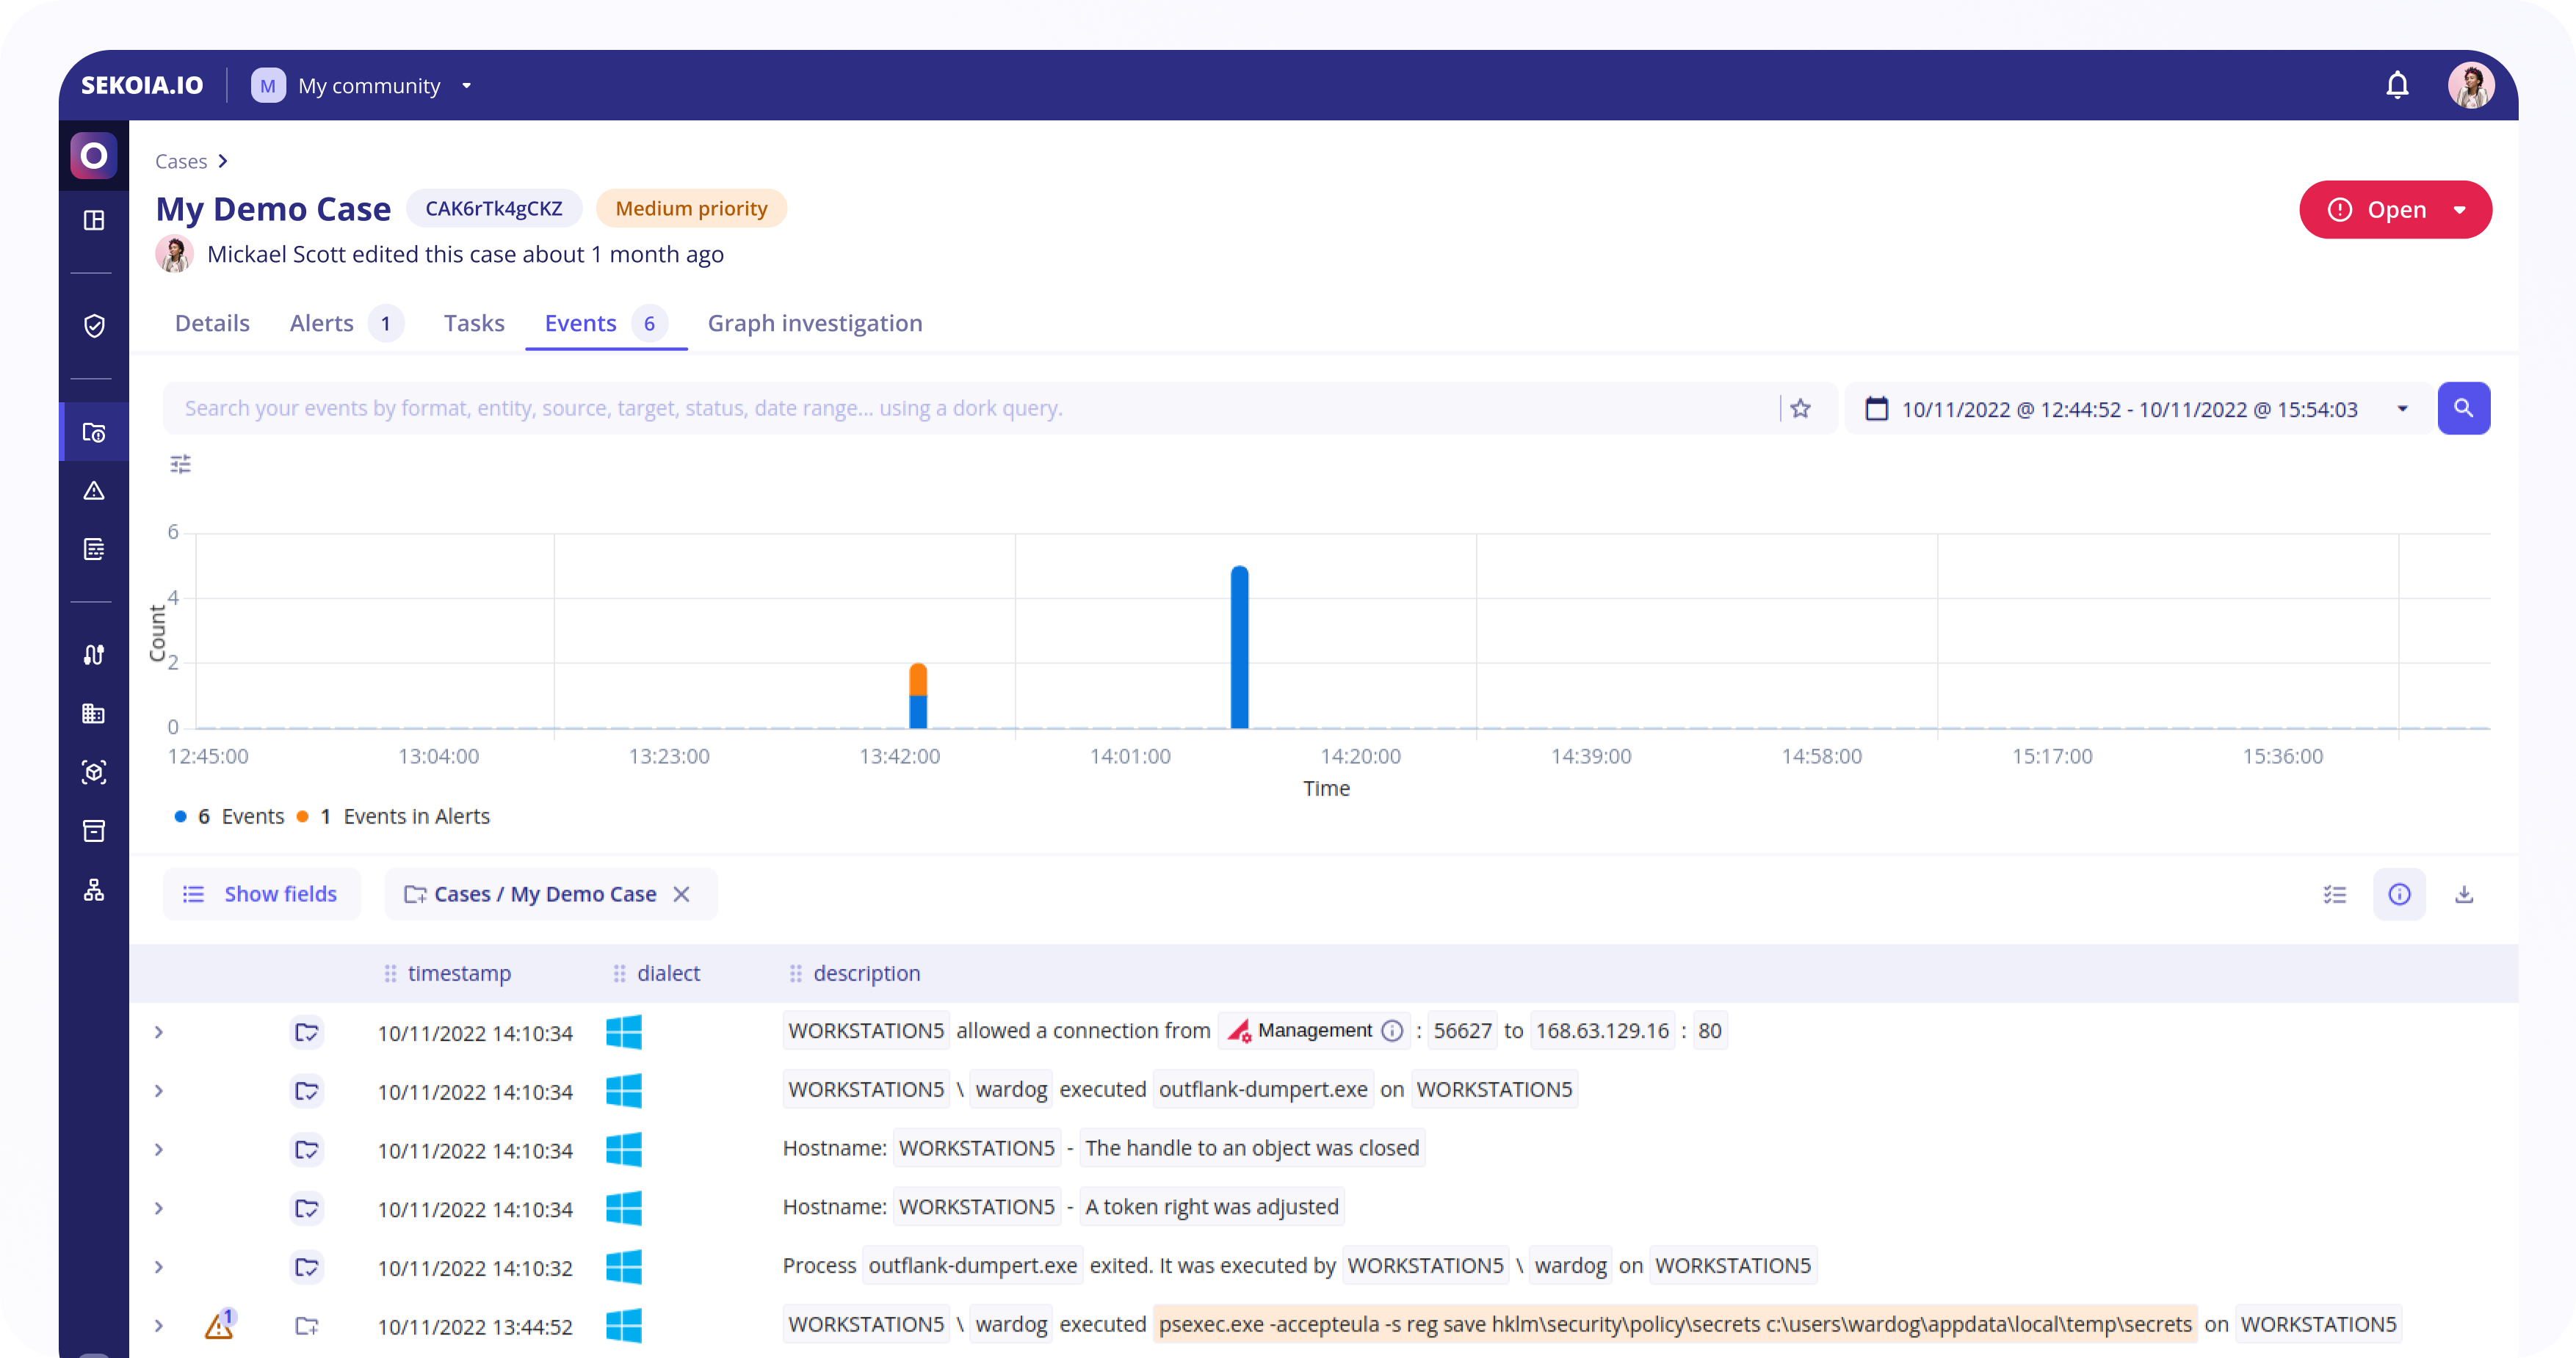
In the header, you can find the name of the case, the person that created it, the last edition date, a tag with the case ID that you can easily copy by clicking on it, the priority and the status.
The different sections of the page are then separated into 5 tabs: Details, Alerts, Tasks, Events, and Graph Investigation.
Details tab
The Details tab contains basic information about the case:
- Authors, the community, and the dates of creation and edition of the case
- A description of the case that uses Markdown to enable you to format your text
- A timeline displaying comments
Alerts tab
The Alerts tab contains a list of alerts that were added to the case.
To add alerts to a case, you can either:
- Use the
Add alertsbutton on this tab
Tip
To add multiple alerts to a case, we recommend to either copy the ID of your case found in the case details page then paste it in the search bar. The case will be displayed then you can select it and click on Add to alerts button.
- Use the
Add to casebutton on the detailed page of any alert
Tip
To add alerts to multiple case, we recommend to copy the ID of your alert found in the alert details page then paste it in the search bar. The alert will be displayed then you can select it OR you can scroll and select all alerts needed and click on Add to case button.
Tasks
The Tasks tab allows you to manage tasks and subtasks associated with the case.
Events
The Events tab lists the events that are associated with the case in a display similar to the Events page.

Events associated with the case are:
- Events that raised an alert that was added to the case.
- Events that were directly added to the case.
When interacting with individual values, it is possible to:
- Filter for: only applies to the events associated with the case
- Filter out: only applies to the events associated with the case
- Search events with this value
The Value Selection mode can be toggled with the button at the top right of the event list to select multiple values in displayed events. The selected values can then be used to:
- Create a Sigma Rule
- Search events with these values
Search Events with this value
The "Search Events with this value" feature can be used to perform a search into all events that occurred during the case's timeframe (+- 1 hour).

The search query is automatically created from selected values.
To search events with a value:
- On the
casepage, go toeventstab - Click on
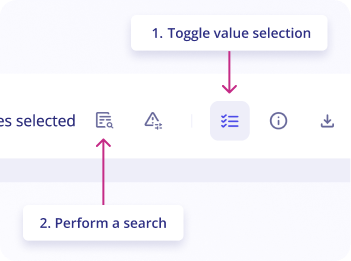
Toggle value selectionbutton in the upper right of the logs list - Select
valuesyou want to search for by clicking on them in the logs list - Click on the button
Perform a searchas shown in the screenshot
A side panel opens with the search results, allowing you to investigate a case without leaving the page.
Graph Investigation
The Graph Investigation tab provides analysts with an interactive graphical visualization of the alert, enabling comprehensive threat analysis through visual correlation of security events and intelligence data.
Note
All changes performed within the Graph Investigation are automatically saved. The graph updates dynamically with each visit based on the events associated with the alert. Any new objects discovered through additional events are automatically integrated into the existing graph structure.
The graph displays the following interconnected elements:
-
Observables: Security artifacts automatically extracted from events, including IP addresses, domain names, URLs, user accounts, file hashes, and other indicators of compromise
-
Observable Relationships: Visual connections between observables represented by directional arrows. These relationships are extracted from events using Smart Description definitions that parse event data to identify logical connections
-
CTI Objects: STIX-compliant threat intelligence objects from the Intelligence database that enrich the analysis with contextual threat information
-
STIX Relationships: Standardized connections between threat intelligence objects that reveal the broader threat landscape
Threat Intelligence
Access comprehensive threat intelligence by clicking on any CTI object within the graph. The left panel immediately displays:
-
Detailed object descriptions and threat context
-
Complete relationship mappings with other intelligence objects
-
Interactive options to expand the graph by adding related objects
This functionality enables quick pivoting through the threat intelligence database, allowing analysts to explore the full scope of related threats and campaigns.
Observable Analysis
Investigate specific observables by clicking on any observable node in the graph. The left panel provides:
-
Event Context: All events within the alert that contain the selected observable, presented with Smart Description summaries for quick comprehension
-
Full Event Details: Complete event information accessible through the right-side panel via the "Full Events" button
-
Extended Search: Direct access to search for additional events containing the same observable value across your entire environment
This multi-layered approach ensures analysts can quickly understand both the immediate context and broader implications of each observable.
Layers Management
Layers enhance analytical efficiency by organizing complex graphs into manageable, focused sections that can be viewed independently or in combination.
Understanding Layers
Layers represent logical groupings within your graph that can be selectively displayed or hidden. This feature transforms complex visualizations into organized, digestible sections while maintaining the ability to view the complete picture when needed.
Default Layer Behavior
Every graph investigation automatically creates a default layer upon first access. This foundational layer:
- Serves as the primary container for initial graph elements
- Automatically incorporates new objects as additional events are processed
- Maintains continuity across investigation sessions
Active Layer Management
The layer control interface, located in the top-left corner adjacent to the main panel, provides:
- Layer Panel Access: One-click access to the complete layer management interface
- Active Layer Indicator: Clear identification of the currently selected layer where new additions will be placed
- Layer Switching: Instant transitions between different analytical perspectives
Creating and Managing Layers
To create and organize layers:
- Click the name of the default layer in the top-left of the graph (e.g. Event Layer #1)
- Select the “+” button to add a new layer
- Enter a name for your layer.
- Drag and drop objects or observables into the layer of your choice.
All changes are saved automatically—no manual action required.
Viewing Layer Content
- To focus only on the contents of a specific layer, toggle visibility by clicking the Eye icon.
Use this functionality to reduce visual clutter and isolate relevant data for deeper analysis.
Strategic Layer Usage for Cases**
Optimize your case investigation by implementing these layer organization strategies:
- Alert-Based Organization: Create separate layers for each alert when dealing with cases containing a manageable number of distinct alerts, enabling focused analysis of individual attack phases
- Temporal Analysis: Organize layers by time periods or dates to understand attack progression and identify patterns across different phases of the campaign
- Attack Vector Segregation: Separate layers for different attack techniques, entry points, or affected systems to isolate analysis domains
- Threat Actor Attribution: Create distinct layers when multiple threat actors or attack campaigns are suspected within the same case
Advanced Layer Features
- Visibility Control: Toggle individual layer visibility to focus analytical attention on specific case aspects while temporarily hiding others
- Cross-Layer Movement: Relocate misplaced objects between layers to maintain optimal organization as your case investigation evolves
- Dynamic Renaming: Update layer names throughout the investigation to reflect evolving understanding and maintain clear organization across complex cases
- Intelligent Search: Utilize the built-in search functionality to quickly locate specific objects within large, multi-layered case graphs, essential for complex investigations with extensive observable networks spanning multiple alerts
These enhanced capabilities ensure that even the most complex multi-alert cases remain manageable and analytically productive, enabling analysts to maintain situational awareness across extended attack campaigns while drilling down into specific details when needed.