Create and manage dashboards
Learn how to use the Dashboards Listing to organize your views, create new Dashboards, and set your homepage.
The dashboards listing page
The Dashboards listing page is your central hub for managing access to all Dashboards. To access it, in the left handed panel, click on Dashboards.
It provides a table with the following information:
- Name: The title of the Dashboard.
- Last edition: Date and time of the last modification.
- Modified/Created by: The user who created or last changed the Dashboard.
- Number of Widgets: The total count of Widgets included.
Filter and sort
To quickly find a Dashboard, you have a few options accessible from the top of listing page:
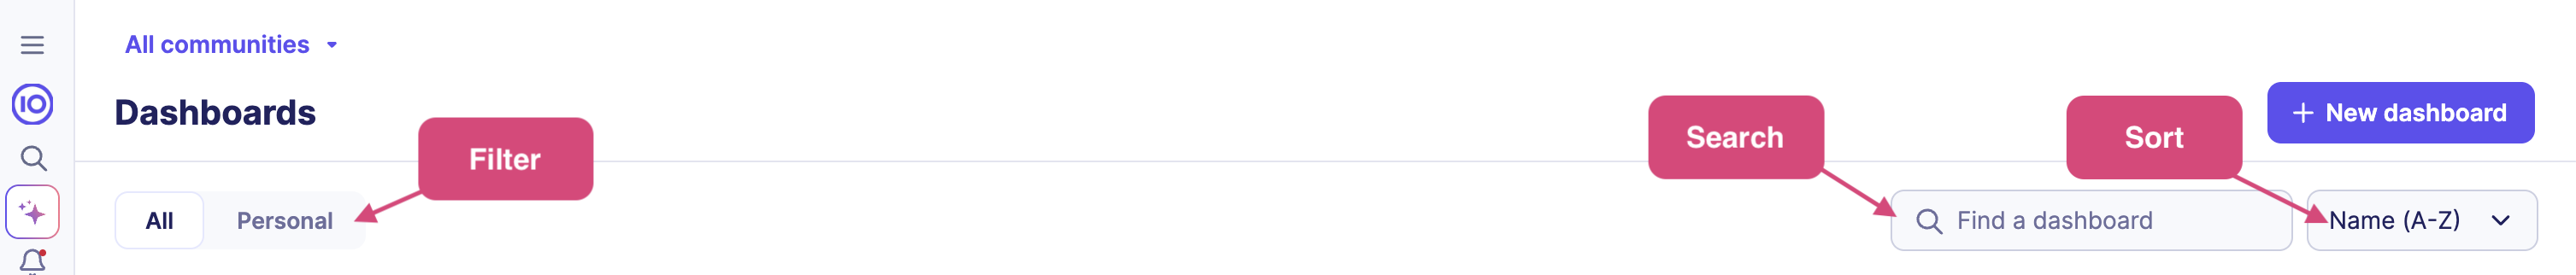
- Search: Enter keywords in the search bar to retrieve a specific dashboard.
- Filter: Choose between All community dashboards or Personal dashboards (Created by me).
- Sort: Arrange by A-Z or Last edition (newest to oldest).
Create a new dashboard
You can easily create a new Dashboard directly from the Listing page:
- Click the + New dashboard button.
- Start building your custom view.
Note
Dashboards you create will be available to all members of your community.
Manage existing dashboards
To perform the following actions, click the (...) button associated with any Dashboard in the list:
Duplicate
Select Duplicate to automatically create a copy of the Dashboard with all its Queries and Widgets.
Delete
Select Delete to remove the Dashboard.
Warning
This will remove the dashboard for all members of the community.
Set as homepage
Select Set as homepage to make this Dashboard your default landing page.
- Every time you log in, you will land directly on this Dashboard.
- You can change your default homepage at any time.
Managing time ranges
Managing the time range is essential for analyzing trends over specific periods. The Dashboard offers flexible options for configuring the time range for each Widget or the overall view.
Dashboard date range
For Built-in Widgets, you can synchronize the time range with the overall Dashboard's date range.
- This is set using the range selector prominently displayed at the top of the Dashboard.
- Adjusting this selector updates all Built-in Widgets configured to follow the Dashboard's global date.
Widget-specific time range
By default, each Widget can be configured to display data for its own specific time period.
- This allows for detailed analysis where different Widgets focus on different time frames simultaneously (e.g., real-time monitoring vs. 30-day trends).
- Each Widget clearly displays the time range it is currently using.
Refreshing data
Ensuring that the data displayed is up-to-date is critical for accurate monitoring. By default, the Dashboard shows data computed during the last refresh.
Manual refresh
To manually update data across all Widgets on the current Dashboard:
- Click the Refresh button located near the top of the Dashboard.
- The date and time of the last successful refresh are displayed next to the button.
Note
You can only trigger a manual refresh once every minute.
Auto-refresh
If you prefer automated updates, you can enable the Auto-refresh option in the Dashboard settings.
- When enabled, all Widgets automatically refresh every 30 minutes.
- This ensures your data stays current without manual intervention.
Next steps
- Your Dashboard is created; now populate it by Configuring Widgets and layout.