Asset connector health status and logs
Reveal module — This feature requires the Reveal add-on module.
The asset connectors panel provides visibility into whether a connector is experiencing errors and what happened during its recent activity. Use it to confirm successful synchronizations, identify issues preventing asset collection, and gather precise error details for troubleshooting or escalation.
Access the asset connectors panel
- Navigate to Configure > Assets.
- To open the Asset Connectors panel, click on the Asset connectors button (upper hand side of the Assets page).
From this panel, you can review connector error states and open detailed logs for a specific connector.
View connector error states
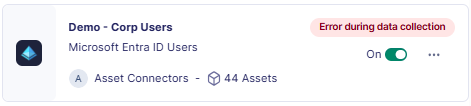
The asset connectors panel displays error states when issues affect a connector. If no error is affecting a connector, no error state is displayed.
Possible error states
| State | Condition | Description |
|---|---|---|
| Error during data collection | More than 5 error logs in the last 24 hours | The connector is still functional and running but has encountered repeated errors during data collection. |
| Stopped by critical error | Critical errors have forced the connector to stop | The connector is no longer running and requires intervention. |
View connector logs
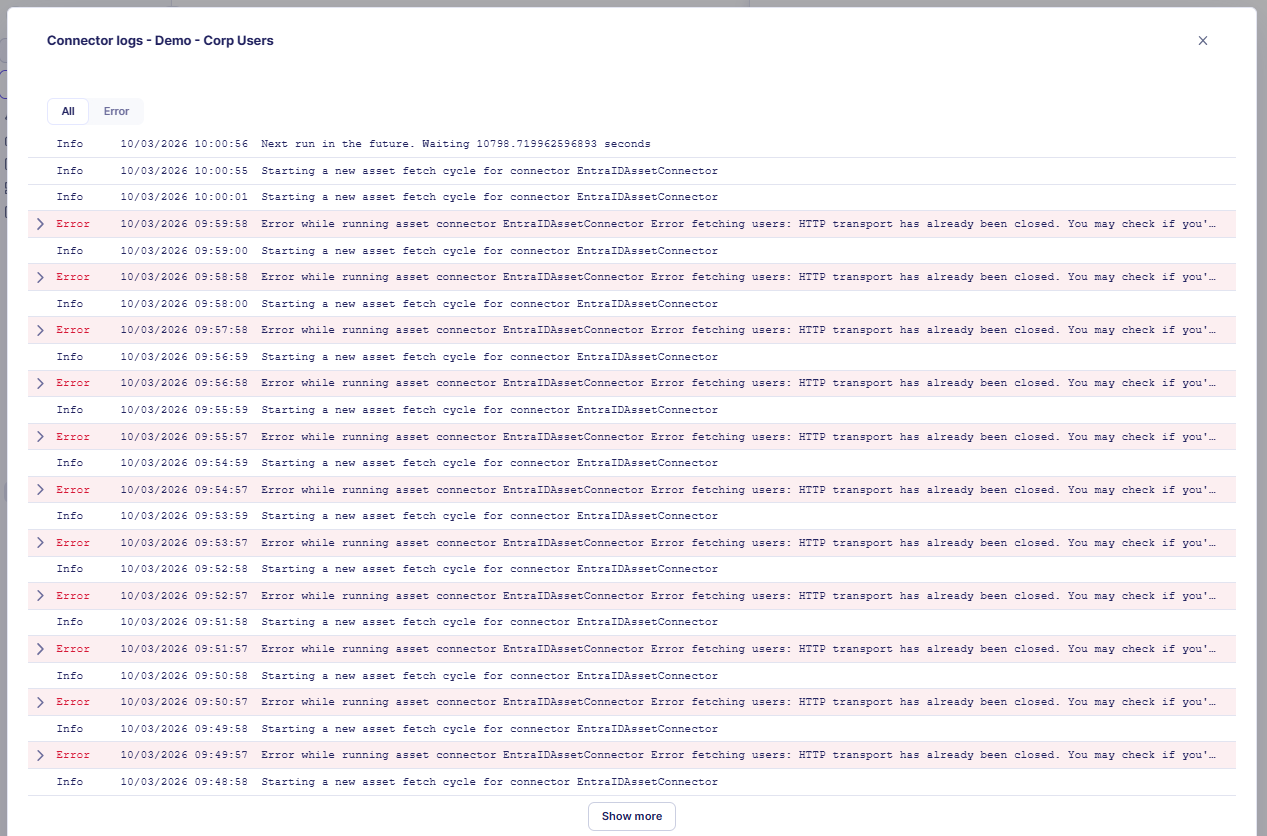
Connector logs help you understand what happened during a connector run. Use them to confirm whether a synchronization completed successfully, check when the last synchronization occurred, and investigate authentication, API quota, or connectivity issues.
Open connector logs
- Navigate to Configure > Assets.
- Open the Asset Connectors panel.
- Open the ... menu for the connector you want to inspect.
- Select View logs.
Review recent runs first
Start by reviewing the most recent runs to determine whether the issue is ongoing or limited to a single execution.
What the logs show
For each connector run, the logs can include the following information.
Run status
A high-level indication of log severity, such as:
| Status | Description |
|---|---|
| Info | Normal operational information |
| Debug | Detailed diagnostic output |
| Error | Issues encountered during the run |
Timestamps
| Field | Description |
|---|---|
| Start time | When the connector run began |
| End time | When the connector run completed |
| Duration | Total time elapsed for the run |
Execution details
Useful information about what happened during the run, including:
- connection attempts made to the source system
- authentication steps and outcomes
- requests sent to the source system
- objects or records processed
- import, update, or skip actions applied to assets
Related links
- Asset context panel — Full reference for the asset context panel, which displays data enriched by asset connectors including security controls, vulnerabilities, and hygiene information.
- Attack path visualization — How attack path graph enrichment depends on asset connectors providing relationship and exposure data.
- Integration — Asset categories — Reference documentation for asset connector categories and integration setup.
- Collect — Assets — How assets are configured and discovered in Sekoia, including the role of asset connectors in the collection pipeline.