Attack path visualization
Reveal module — This feature requires the Reveal add-on module.
Attack path visualization is a graph-based view accessible from the asset context panel. It maps observed authentication relationships between hosts and users to show how an attacker could move through an environment from a given asset. This article covers the graph structure, navigation controls, interpretation guidance, and remediation workflow in detail.
Prerequisites
To use attack path visualization, your community must be subscribed to the Reveal add-on module, host and user assets must be available, and authentication telemetry related to those assets must be ingested. Enrichment quality depends on connected sources such as asset connectors, the Sekoia endpoint agent (with hygiene enabled), and other risk signals. Incomplete telemetry or missing integrations may reduce path completeness.
Open attack path visualization
- Open the asset context panel for a host or user asset: from an alert, event, case, or the asset listing.
- On the top right corner of the asset context panel, select the Visualize the attack path for this asse button.

Understand the graph
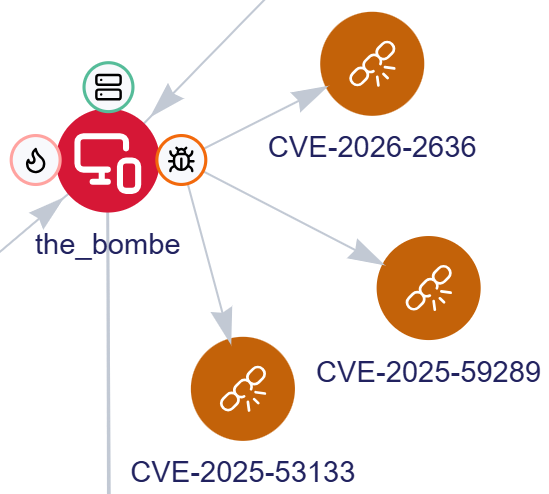
The graph is built around three elements: nodes, satellite nodes, and relationships.
Nodes
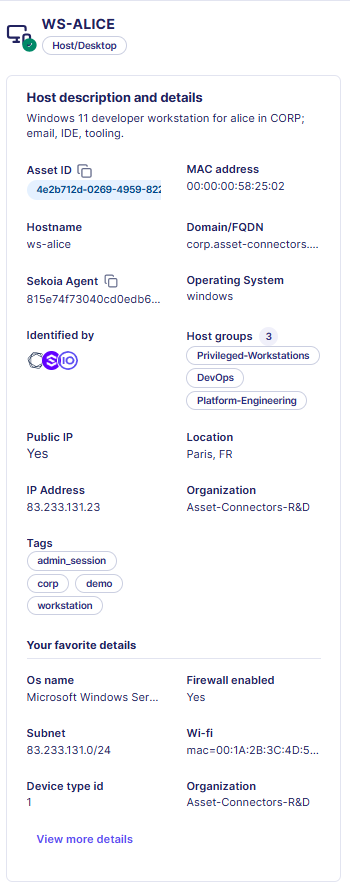
Nodes represent assets involved in the path: hosts, users, and accounts. Node color reflects the configured asset criticality, giving an immediate sense of which assets in the path are high value.
Clicking any node opens a detail panel showing the asset context for that node, so you can assess its role in the path without navigating away.
Satellite nodes
Depending on available asset enrichment, each node can display satellite nodes that summarize its current exposure and security context.

| Satellite node | Description |
|---|---|
| Public IP | Whether the asset has a public IP address |
| Cases | Cases associated with the asset in the last 30 days; color reflects the highest case priority |
| Alerts | Alerts associated with the asset in the last 30 days; color reflects the highest alert urgency |
| Hygiene | Whether the asset has hygiene issues such as a disabled firewall or missing encryption |
| Vulnerabilities | Whether the asset has vulnerability findings; color reflects the highest severity |
Display limit
Cases and alerts currently display up to 5 items in total across both satellite nodes.
Select a satellite node to expand it and review its details.
Relationships
Relationships represent authentication connections that may enable progression from one asset to another. They reflect access and trust relationships, identity usage patterns, asset connectivity, and inherited exposure through another entity.
Relationships are derived from observed authentication logs. Together with nodes, they show how one risk can enable another.
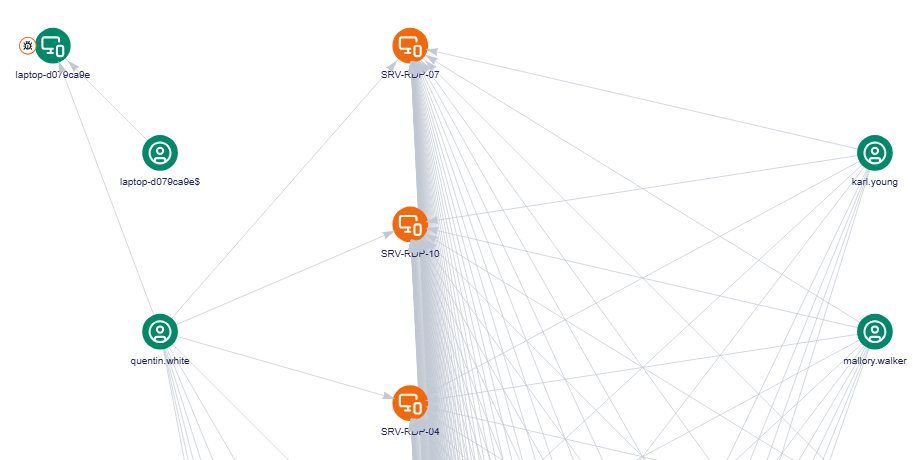
Navigate the graph
Attack path visualization includes several controls to help you explore larger or more complex graphs.
| Control Name | Control Image | Description |
|---|---|---|
| Refresh |  |
Select Refresh to reload the graph based on the currently selected asset and settings. When refreshing, adjust the number of levels to display. A level represents how many relationship steps away from the selected node the graph will show. Tip: Start with fewer levels Start with fewer levels and expand only when you need to trace additional relationships. This keeps the graph readable and improves performance. |
| Graph overview |  |
Select Graph overview to highlight asset nodes by type, such as users or hosts. This helps identify specific asset categories in larger graphs. |
| Layout controls |  |
Select a layout option to change how nodes and relationships are rendered. A vertical or horizontal layout may make relationships easier to follow depending on the shape of the graph. |
| Zoom |  |
Use the Zoom controls or your mouse scroll wheel to focus on a specific area or step back to view the larger structure. |
| Center |  |
Select Center to re-center the graph in the current view. |
| Full screen |  |
Select Full screen to expand the graph for analyzing larger relationship maps more comfortably. |
| Lock & Unlock |  |
Select Lock to preserve the current graph layout during an investigation. When locked, the layout remains stable as you interact with nodes and review paths, preventing the graph from reorganizing itself. Select Unlock when you want the graph to become dynamic again. |
Lock and refresh
A locked graph is preserved until you refresh it. Once refreshed, the graph is recalculated and the layout may change based on current data and settings.
Interpret the graph
A visible path indicates exposure and reachability, not confirmed attacker activity.
Paths are not proof of compromise
A visible path does not prove attacker activity. Always review attack paths alongside alerts, investigations, exposure context, and business context before drawing conclusions.
Use the graph to answer questions such as:
- Can this compromised host lead to something more critical?
- Does this account provide a path to a sensitive host?
- Which node acts as a bridge to a high-value target?
- Which remediation step would break the path most effectively?
Investigate using attack path visualization
A typical investigation workflow:
- Start from a suspicious or exposed asset (host or account).
- Follow the path to identify what may be reachable from that asset.
- Identify intermediate hosts or accounts acting as stepping stones.
- Determine whether the path leads to a privileged or sensitive target.
- Prioritize remediation on the node or relationship that breaks the path most effectively.
This workflow is especially useful when validating the impact of an exposure, assessing the blast radius of a compromised node, or deciding where remediation will have the greatest effect.
Prioritize remediation
Attack path visualization helps you focus remediation efforts on changes that reduce attacker reach most effectively. Examples include:
- removing unnecessary privileges from accounts that act as bridges
- segmenting connectivity between systems
- hardening exposed hosts with poor hygiene scores
- disabling or securing risky accounts
- addressing the node that provides access to critical assets
In many cases, breaking a single relationship can disrupt the full path.
Related links
- Asset context panel — Discover the other information accessible with the asset context panel, including hygiene, vulnerability, and security control data for the same asset.
- Points of interest — Behavioral signals surfaced on assets that can complement attack path analysis by adding context about unusual login patterns or anomalous activity.
- Asset connector health status and logs — How to monitor and troubleshoot the asset connectors that provide the enrichment data powering the attack path graph.
- Collect — Assets — How assets are configured and discovered, which determines the data available in the graph.