Akamai Guardicore Saas
Overview
Akamai Guardicore delivers application-centric microsegmentation and breach detection to prevent lateral movement across on-premises and cloud environments. With process-level visibility, dynamic policy orchestration and automated workflows, it enforces Zero Trust controls at scale. Simplify network segmentation, accelerate threat response and maintain continuous compliance for critical assets.
- Vendor: Akamai
- Supported environment: SaaS
- Detection based on: Alert, Telemetry
- Supported application or feature: see section below
Warning
Important note - This format is currently in beta. We highly value your feedback to improve its performance.
Akamai Guardicore event types supported
Here is a list of all the Akamai Guardicore event types supported by this integration:
- Incident
- Audit log
- Network log
Configure
This setup guide will show you how to forward your Akamai Guardicore events to Sekoia.io.
Steps to follow
- Create an intake
- Set up the forwarding for Events
- Set up the forwarding for Network Logs
Create an intake
Go to the intake page and create a new intake from the format Akamai Guardicore. Copy the intake key.
Set up the forwarding for Events
- Log in to the Akamai Guardicore console
- In the left panel, go to
System>INTEGRATION>Data Exporters
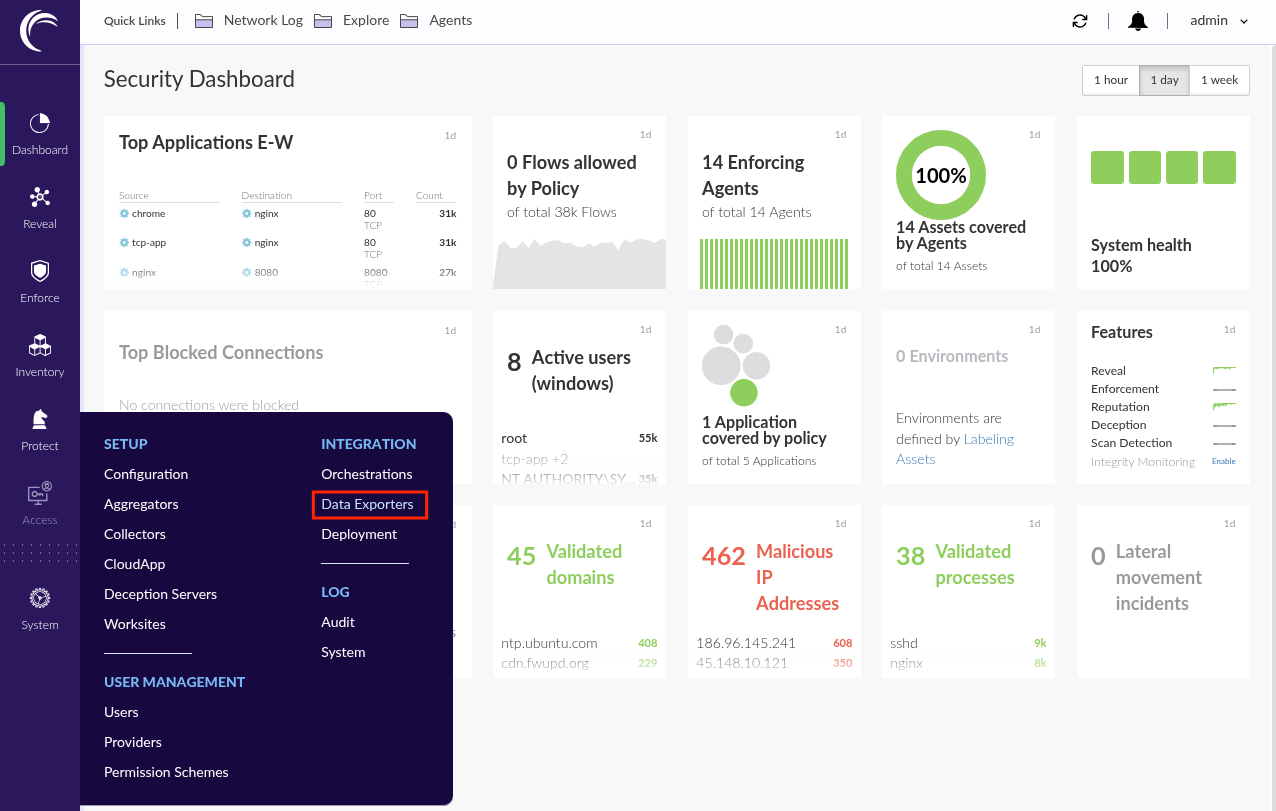
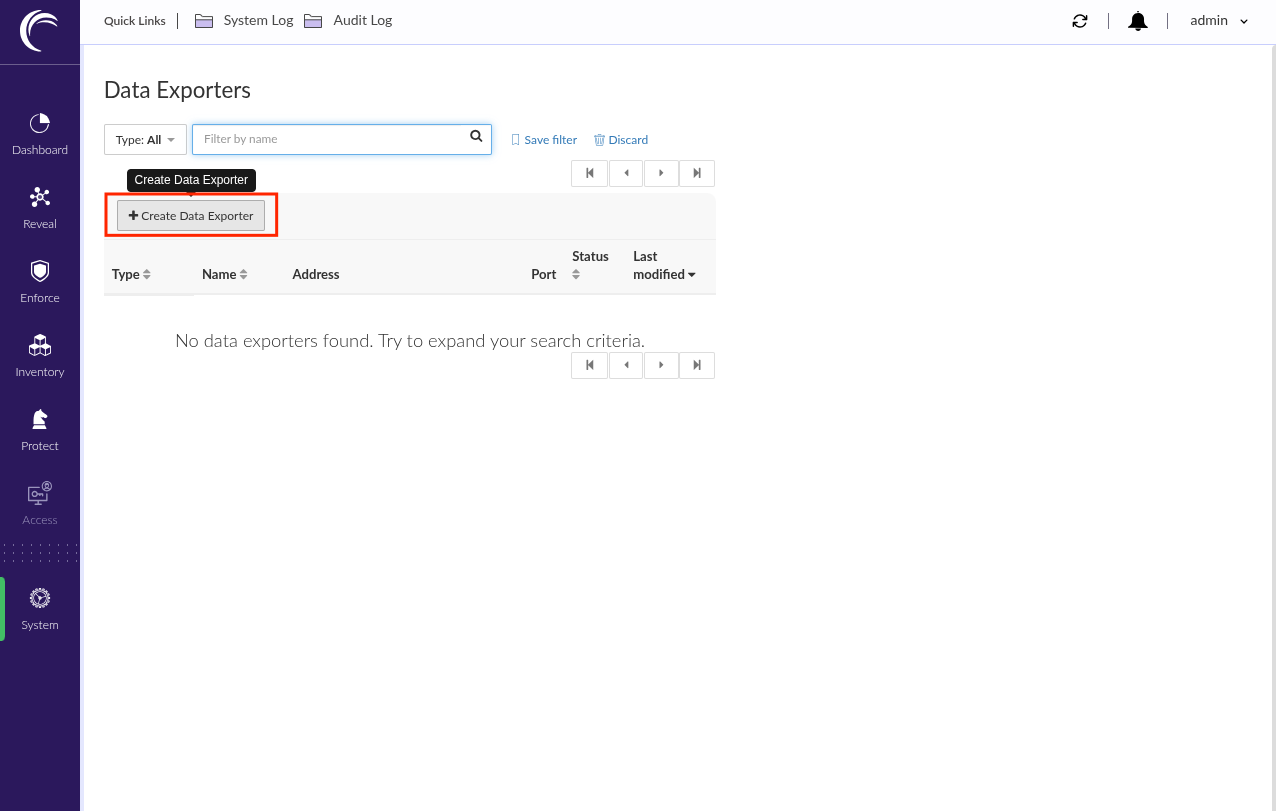
- Click
+ Create Data Exporter
- Select
Events syslog Exporter - Type a name for the exporter configuration (e.g:
Sekoia.io Events exporter) -
In the
Connection optionssection:- Type
intake.sekoia.ioasSyslog host - Type
10514asSyslog port - Select
TCPasSyslog protocol - Enable
Use TLS
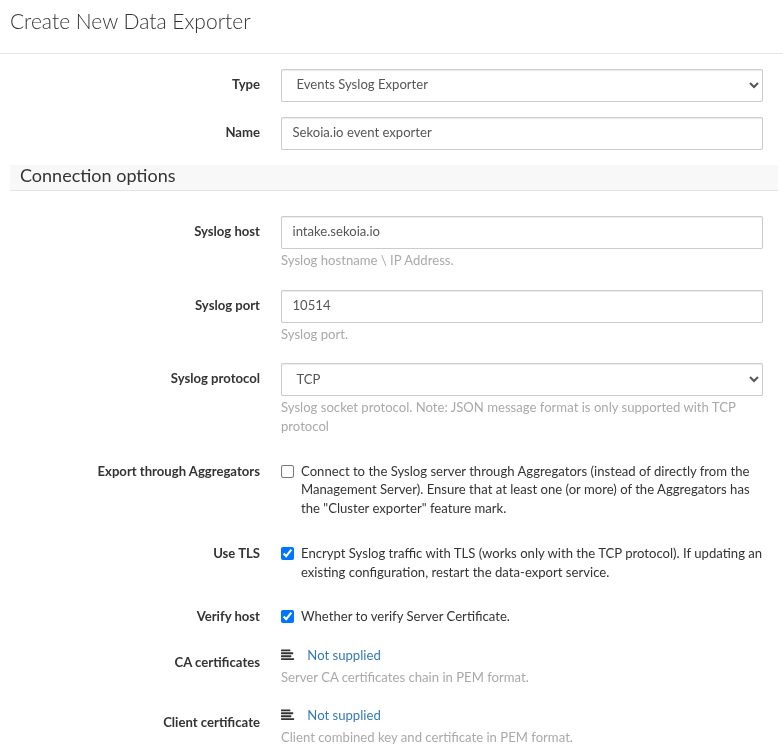
- Type
Warning
The previous domain works for the FRA1 region. For any other region, replace the domain “intake.sekoia.io” with your region’s Syslog-intake domain—for example:
intake.usa1.sekoia.io:10514
You can find your region’s domain here: https://docs.sekoia.io/getting_started/regions/
-
In the
Exporting optionssection:- Enable
Export incidents - Disable
Export Agent Logs - Enable
Audit Logs
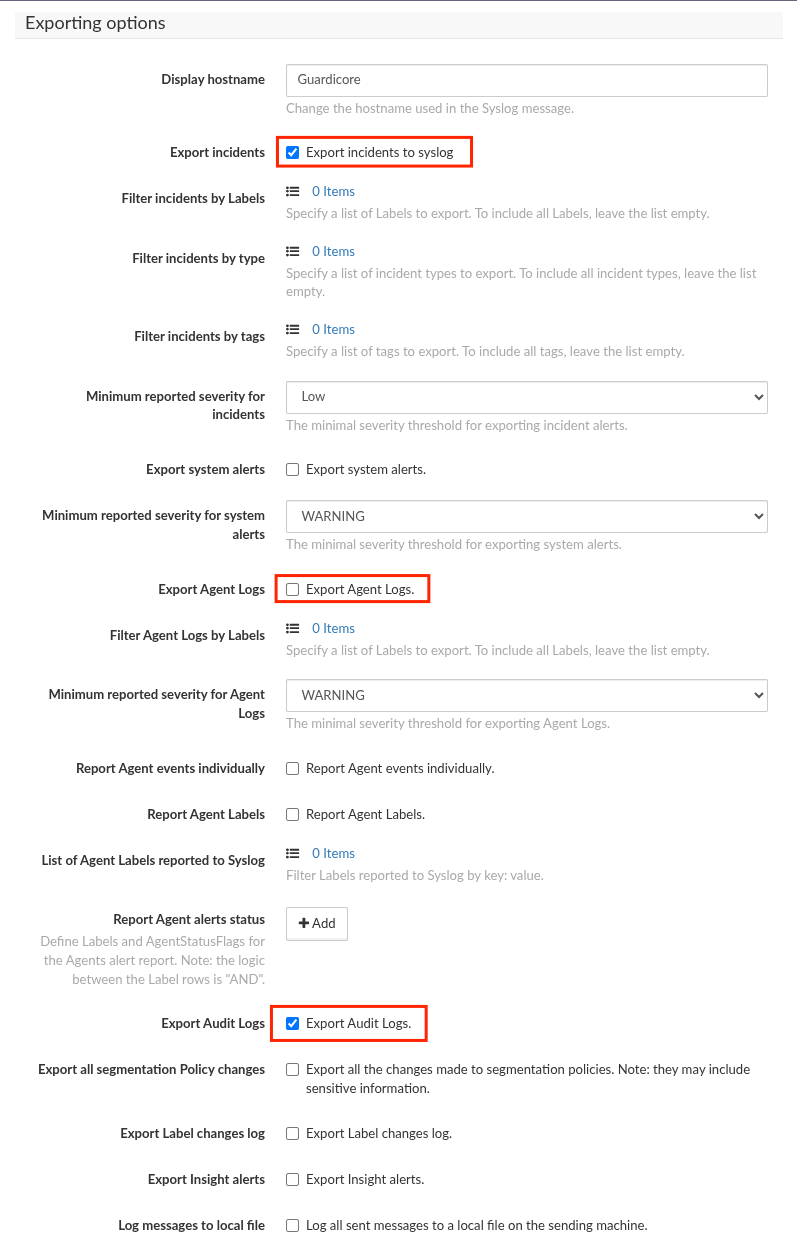
- Enable
-
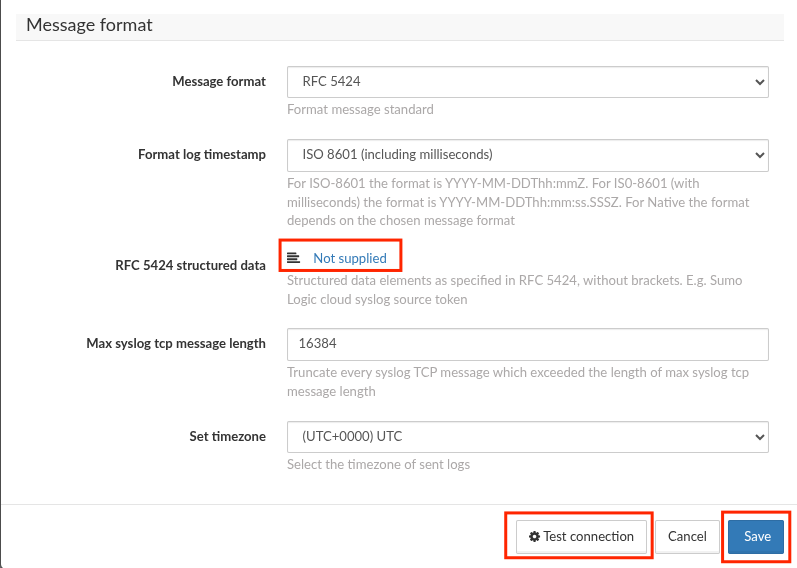
In the
Message formatsection:- Select
RFC5424asMessage format - Select
ISO8601 (including milliseconds)asFormat log timestamp - Click
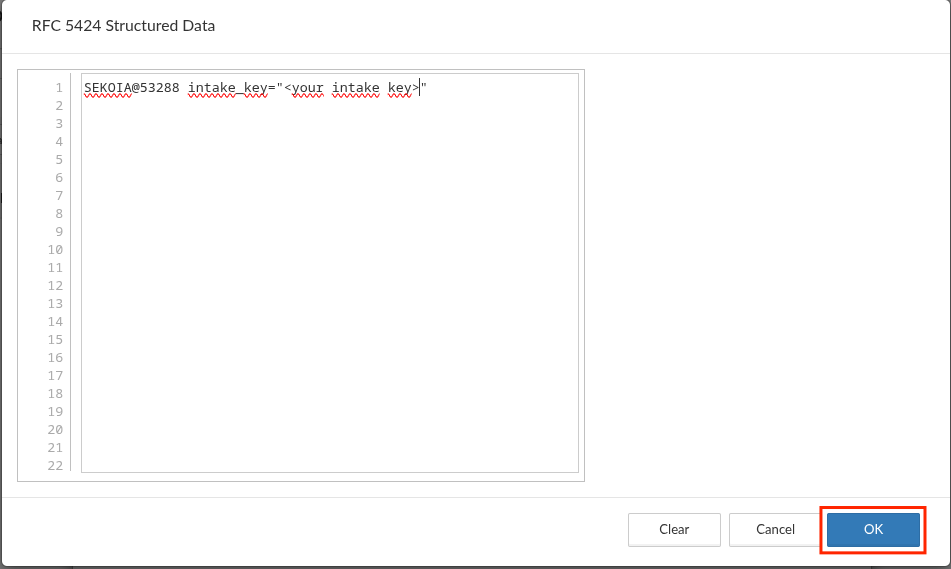
Not suppliedon theRFC5424 structured dataoption -
In the dialog
- Paste:
SEKOIA@53288 intake_key="<YOUR_INTAKE_KEY_HERE>" - Replace
<YOUR_INTAKE_KEY_HERE>with the intake key created with the intake - Click
OK
- Paste:
-
Click
Test Connection - Click
Save
- Select
Set up the forwarding for Network logs
- Click
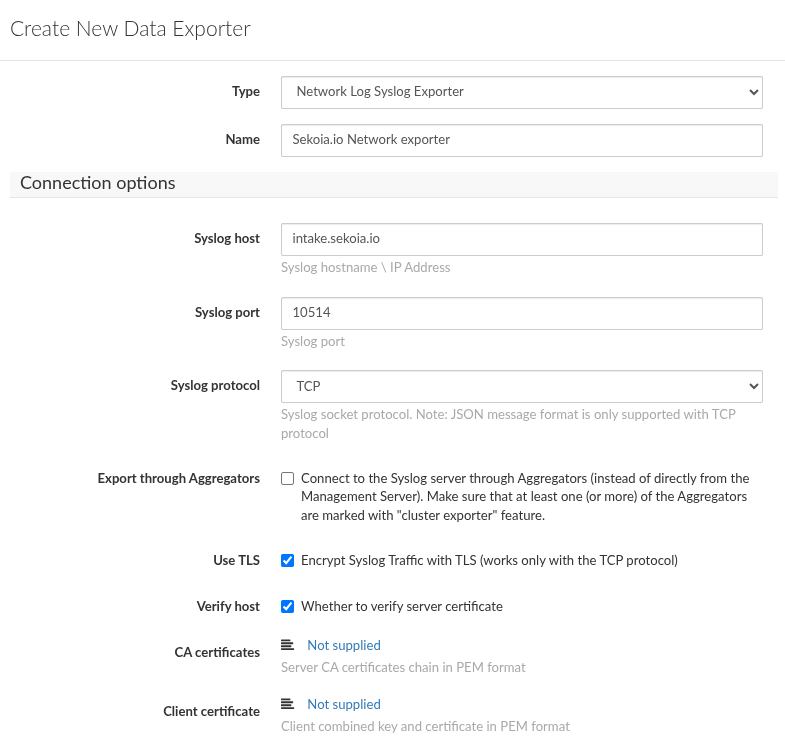
+ Create Data Exporter
- Select
Network Log syslog Exporter - Type a name for the exporter configuration (e.g:
Sekoia.io Network Log exporter) -
In the
Connection optionssection:- Type
intake.sekoia.ioasSyslog host - Type
10514asSyslog port - Select
TCPasSyslog protocol - Enable
Use TLS
- Type
Warning
The previous domain works for the FRA1 region. For any other region, replace the domain “intake.sekoia.io” with your region’s Syslog-intake domain—for example:
intake.usa1.sekoia.io:10514
You can find your region’s domain here: https://docs.sekoia.io/getting_started/regions/
-
In the
Exporting optionssection:- Click
+ Add - Create
export verdictsfor:AllowedBlockedAlertedAllowed and Encrypted
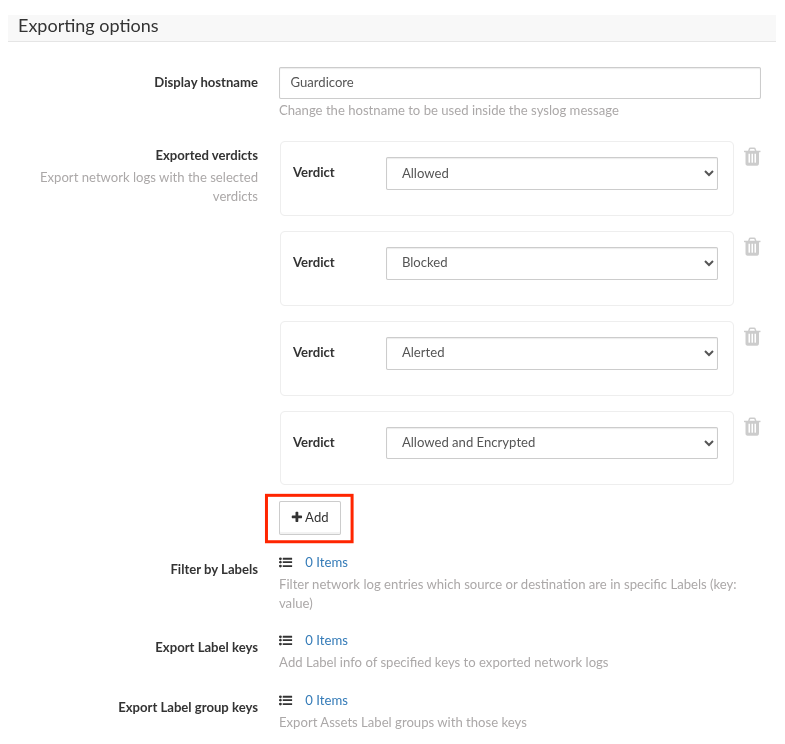
- Click
-
In the
Message formatsection:- Select
RFC5424asMessage format - Select
ISO8601 (including milliseconds)asFormat log timestamp - Click
Not suppliedon theRFC5424 structured dataoption -
In the dialog
- Paste:
SEKOIA@53288 intake_key="<YOUR_INTAKE_KEY_HERE>" - Replace
<YOUR_INTAKE_KEY_HERE>with the intake key created with the intake - Click
OK
- Paste:
-
Click
Test Connection - Click
Save
- Select
Raw Events Samples
In this section, you will find examples of raw logs as generated natively by the source. These examples are provided to help integrators understand the data format before ingestion into Sekoia.io. It is crucial for setting up the correct parsing stages and ensuring that all relevant information is captured.
New audit log entry reported by the Guardicore Security Suite;;Username: admin;IP Address: 192.0.2.1;;Title: Run Data Exporter Integration Test Connections;;Description: None
New Audit log entry reported by the Guardicore Security Suite;;Username: admin;IP Address: 192.0.2.1;; Title: Adding new Syslog integration configuration; Description: Created label group Role: App (id: 7de50df5-f530-4752-9450-553cce25ebd2)
New audit log entry reported by the Guardicore Security Suite;;Username: None;IP Address: 192.0.2.1;;Title: Access to unknown resource;;Description: Access to resource: /api/login with status code: 404
New audit log entry reported by the Guardicore Security Suite;;Username: jdoe;IP Address: 192.0.2.1;;Title: Authentication success;;Description: User jdoe authenticated successfully
New test connection entry reported by the Guardicore Security Suite;;Username: None;IP Address: 192.0.2.10;;Title: Run Data Exporter Integration Test Connections;;Description: Test successful
New low severity security incident reported by the Guardicore Security Suite;;ID: 00000000-0000-0000-0000-000000000000;URL: https://lab.example.com/overview/incidents/00000000-0000-0000-0000-000000000000;;Description: A request was made to an IP address with a bad reputation;;Severity: low;Start Time: 2026-04-07T08:47Z;End Time: 2026-04-07T08:47Z;;Rule ID: No rule;Affected Assets:;192.0.2.1 (source);destination.test.org (destination);;Destination labels: Role: FE;Terraform: True;Worksite: Default;App: CRM;Environment: Development;os_name: Ubuntu 24.04.4 LTS;os_type: Linux;;Tags: Known Phishing, Known Malware;;Summary: ;1. IP address 198.51.100.50:22, communicating with asset destination.test.org (192.0.2.2), was identified as Known Malware and Known Phishing by Guardicore Reputation Service.;Direction: Inbound;
New network connection reported by the Guardicore Security Suite;ID: eac74b0a;Connection type: FAILED; Action: Blocked;Count: 1;Time: 2024-04-03T02:05:40.611Z;Source IP: 192.0.2.1;Source process name: Unknown Client;Source application name: Unknown Client;Destination IP: 192.0.2.2;Destination port: 22;Destination asset name: hostname.local;Destination user name: root;Destination process name: sshd;Destination process path: /usr/sbin/sshd;Destination process name: sshd;Protocol: TCP;Connection verdict: blocked_by_destination;Policy rule: 11234vs-4573-7432-7543-2342gsdf436; Incidents: 11124vs-2342-1231-6543-2342gsdf424
New network connection reported by the Guardicore Security Suite;ID: eac74b0a;Connection type: SUCCESSFUL; Action: Allowed;Count: 1;Time: 2024-04-03T02:05:40.611Z;Source IP: 192.0.2.5;Source process name: Unknown Client;Source application name: Unknown Client;Destination IP: 192.0.2.6;Destination port: 67;Destination asset name: hostname.local;Destination user name: root;Destination process name: sshd;Destination process path: /usr/sbin/dnsmasq;Destination process name: sshd;Protocol: UDP;Connection verdict: allowed;Policy rule: default; Incidents: 11124vs-2342-1231-6543-2342gsdf424
Detection section
The following section provides information for those who wish to learn more about the detection capabilities enabled by collecting this intake. It includes details about the built-in rule catalog, event categories, and ECS fields extracted from raw events. This is essential for users aiming to create custom detection rules, perform hunting activities, or pivot in the events page.
Related Built-in Rules
The following Sekoia.io built-in rules match the intake Akamai Guardicore Cloud [BETA]. This documentation is updated automatically and is based solely on the fields used by the intake which are checked against our rules. This means that some rules will be listed but might not be relevant with the intake.
SEKOIA.IO x Akamai Guardicore Cloud [BETA] on ATT&CK Navigator
Active Directory Data Export Using Csvde
Detects the use of Csvde, a command-line tool from Windows Server that can be used to export Active Directory data to CSV files. This export doesn't include password hashes, but can be used as a discovery tool to enumerate users, machines and group memberships.
- Effort: elementary
AdFind Usage
Detects the usage of the AdFind tool. AdFind.exe is a free tool that extracts information from Active Directory. Wizard Spider (Bazar, TrickBot, Ryuk), FIN6 and MAZE operators have used AdFind.exe to collect information about Active Directory organizational units and trust objects
- Effort: elementary
Adexplorer Usage
Detects the usage of Adexplorer, a legitimate tool from the Sysinternals suite that could be abused by attackers as it can saves snapshots of the Active Directory Database.
- Effort: advanced
Advanced IP Scanner
Detects the use of Advanced IP Scanner. Seems to be a popular tool for ransomware groups.
- Effort: master
Aspnet Compiler
Detects the starts of aspnet compiler.
- Effort: advanced
Bloodhound and Sharphound Tools Usage
Detects default process names and default command line parameters used by Bloodhound and Sharphound tools.
- Effort: intermediate
Burp Suite Tool Detected
Burp Suite is a cybersecurity tool. When used as a proxy service, its purpose is to intercept packets and modify them to send them to the server. Burp Collaborator is a network service that Burp Suite uses to help discover many kinds of vulnerabilities (vulnerabilities scanner).
- Effort: intermediate
Certificate Authority Modification
Installation of new certificate(s) in the Certificate Authority can be used to trick user when spoofing website or to add trusted destinations.
- Effort: master
Certify Or Certipy
Detects the use of certify and certipy which are two different tools used to enumerate and abuse Active Directory Certificate Services.
- Effort: advanced
Cobalt Strike Default Beacons Names
Detects the default names of Cobalt Strike beacons / payloads.
- Effort: intermediate
Correlation Potential DNS Tunnel
Detects domain name which is longer than 62 characters and requested at least 50 times in a 10 minutes range time. Long domain names are distinctive of DNS tunnels.
- Effort: advanced
Cryptomining
Detection of domain names potentially related to cryptomining activities.
- Effort: master
DNS Query For Iplookup
Detects dns query of observables tagged as iplookup.
- Effort: master
Dynamic DNS Contacted
Detect communication with dynamic dns domain. This kind of domain is often used by attackers. This rule can trigger false positive in non-controlled environment because dynamic dns is not always malicious.
- Effort: master
Enable Root Account With Dsenableroot
Detects when root is enabled. Attackers can use this as a mean of persistence since root is disabled by default.
- Effort: elementary
EvilProxy Phishing Domain
Detects subdomains potentially generated by the EvilProxy adversary-in-the-middle phishing platform. Inspect the other subdomains of the domain to identify the landing page, and determine if the user submitted credentials. This rule has a small percentage of false positives on legitimate domains.
- Effort: intermediate
Exfiltration And Tunneling Tools Execution
Execution of well known tools for data exfiltration and tunneling
- Effort: advanced
Exfiltration Domain
Detects traffic toward a domain flagged as a possible exfiltration vector.
- Effort: master
HackTools Suspicious Names
Quick-win rule to detect the default process names or file names of several HackTools.
- Effort: advanced
Internet Scanner
Detects known scanner IP addresses. Alert is only raised when the scan hits an opened port, on TCP or UDP. This could be a very noisy rule, so be careful to check your detection perimeter before activation.
- Effort: master
Internet Scanner Target
Detects known scanner IP addresses. Alert is only raised when the scan hits an opened port, on TCP or UDP and group by target address. This could be a very noisy rule, so be careful to check your detection perimeter before activation.
- Effort: master
Kernel Module Alteration
Kernel module installation can be used to configure system settings to automatically execute a program during system boot or logon to maintain persistence or gain higher-level privileges on compromised systems. The prerequisites are to enable monitoring of the finit_module, init_module, delete_module syscalls using Auditbeat.
- Effort: advanced
Network Scanning and Discovery
Tools and command lines used for network discovery from current system
- Effort: advanced
Network Sniffing
List of common tools used for network packages sniffing
- Effort: advanced
Network Sniffing Windows
Network sniffing refers to using the network interface on a system to monitor or capture information sent over a wired or wireless connection. An adversary may place a network interface into promiscuous mode to passively access data in transit over the network, or use span ports to capture a larger amount of data.
- Effort: intermediate
NlTest Usage
Detects attempts to gather information on domain trust relationships that may be used to identify lateral movement opportunities. These command lines were observed in numerous attacks, but also sometimes from legitimate administrators for debugging purposes. The rule does not cover very basics commands but rather the ones that are interesting for attackers to gather information on a domain.
- Effort: advanced
PasswordDump SecurityXploded Tool
Detects the execution of the PasswordDump SecurityXploded Tool
- Effort: elementary
Potential DNS Tunnel
Detects domain name which is longer than 62 characters. Long domain names are distinctive of DNS tunnels.
- Effort: advanced
PsExec Process
Detects PsExec execution, command line which contains pstools or installation of the PsExec service. PsExec is a SysInternals which can be used to execute a program on another computer. The tool is as much used by attackers as by administrators.
- Effort: advanced
RDP Session Discovery
Detects use of RDP session discovery via qwinsta or quser. Used by some threat actors to know if someone is working via RDP on a server.
- Effort: advanced
RTLO Character
Detects RTLO (Right-To-Left character) in file and process names.
- Effort: elementary
Remote Access Tool Domain
Detects traffic toward a domain flagged as a Remote Administration Tool (RAT).
- Effort: master
Remote Monitoring and Management Software - AnyDesk
Detect artifacts related to the installation or execution of the Remote Monitoring and Management tool AnyDesk.
- Effort: master
Remote Monitoring and Management Software - Atera
Detect artifacts related to the installation or execution of the Remote Monitoring and Management tool Atera.
- Effort: master
SEKOIA.IO Intelligence Feed
Detect threats based on indicators of compromise (IOCs) collected by SEKOIA's Threat and Detection Research team.
- Effort: elementary
Sekoia.io EICAR Detection
Detects observables in Sekoia.io CTI tagged as EICAR, which are fake samples meant to test detection.
- Effort: master
Suspicious Double Extension
Detects suspicious use of an .exe extension after a non-executable file extension like .pdf.exe, a set of spaces or underlines to cloak the executable file in spearphishing campaigns
- Effort: advanced
Suspicious TOR Gateway
Detects suspicious TOR gateways. Gateways are often used by the victim to pay and decrypt the encrypted files without installing TOR. Tor intercepts the network traffic from one or more apps on user’s computer, usually the user web browser, and shuffles it through a number of randomly-chosen computers before passing it on to its destination. This disguises user location, and makes it harder for servers to pick him/her out on repeat visits, or to tie together separate visits to different sites, this making tracking and surveillance more difficult. Before a network packet starts its journey, user’s computer chooses a random list of relays and repeatedly encrypts the data in multiple layers, like an onion. Each relay knows only enough to strip off the outermost layer of encryption, before passing what’s left on to the next relay in the list.
- Effort: advanced
Suspicious Windows DNS Queries
Detects a suspicious Windows command-line process making a DNS query via known abuse text paste web services. This is based on Microsoft Windows Sysmon events (Event ID 22).
- Effort: advanced
System Info Discovery
System info discovery, attempt to detects basic command use to fingerprint a host.
- Effort: master
TOR Usage
Detects TOR usage, based on the IP address and the destination port (filtered on NTP). TOR is short for The Onion Router, and it gets its name from how it works. TOR intercepts the network traffic from one or more apps on user’s computer, usually the user web browser, and shuffles it through a number of randomly-chosen computers before passing it on to its destination. This disguises user location, and makes it harder for servers to pick him/her out on repeat visits, or to tie together separate visits to different sites, this making tracking and surveillance more difficult. Before a network packet starts its journey, user’s computer chooses a random list of relays and repeatedly encrypts the data in multiple layers, like an onion. Each relay knows only enough to strip off the outermost layer of encryption, before passing what’s left on to the next relay in the list.
- Effort: master
TOR Usage Generic Rule
Detects TOR usage globally, whether the IP is a destination or source. TOR is short for The Onion Router, and it gets its name from how it works. TOR intercepts the network traffic from one or more apps on user’s computer, usually the user web browser, and shuffles it through a number of randomly-chosen computers before passing it on to its destination. This disguises user location, and makes it harder for servers to pick him/her out on repeat visits, or to tie together separate visits to different sites, this making tracking and surveillance more difficult. Before a network packet starts its journey, user’s computer chooses a random list of relays and repeatedly encrypts the data in multiple layers, like an onion. Each relay knows only enough to strip off the outermost layer of encryption, before passing what’s left on to the next relay in the list.
- Effort: master
Telegram Bot API Request
Detects suspicious DNS queries to api.telegram.org used by Telegram Bots of any kind
- Effort: advanced
Event Categories
The following table lists the data source offered by this integration.
| Data Source | Description |
|---|---|
Network device logs |
Akamai Guardicore logs network traffic |
Network protocol analysis |
Akamai Guardicore logs Network traffic |
Third-party application logs |
Akamai Guardicore logs audit activities and incidents |
In details, the following table denotes the type of events produced by this integration.
| Name | Values |
|---|---|
| Kind | alert |
| Category | authentication, configuration, network, threat |
| Type | access, allowed, change, creation, deletion, denied, info, start |
Transformed Events Samples after Ingestion
This section demonstrates how the raw logs will be transformed by our parsers. It shows the extracted fields that will be available for use in the built-in detection rules and hunting activities in the events page. Understanding these transformations is essential for analysts to create effective detection mechanisms with custom detection rules and to leverage the full potential of the collected data.
{
    "message": "New audit log entry reported by the Guardicore Security Suite;;Username: admin;IP Address: 192.0.2.1;;Title: Run Data Exporter Integration Test Connections;;Description: None",
    "event": {
        "category": [
            "configuration"
        ],
        "dataset": "audit",
        "type": [
            "info"
        ]
    },
    "observer": {
        "product": "Guardicore",
        "type": "bastion",
        "vendor": "Akamai"
    },
    "related": {
        "ip": [
            "192.0.2.1"
        ],
        "user": [
            "admin"
        ]
    },
    "source": {
        "address": "192.0.2.1",
        "ip": "192.0.2.1"
    },
    "user": {
        "name": "admin"
    }
}
{
    "message": "New Audit log entry reported by the Guardicore Security Suite;;Username: admin;IP Address: 192.0.2.1;; Title: Adding new Syslog integration configuration; Description: Created label group Role: App (id: 7de50df5-f530-4752-9450-553cce25ebd2)",
    "event": {
        "category": [
            "configuration"
        ],
        "dataset": "audit",
        "reason": "Created label group Role: App (id: 7de50df5-f530-4752-9450-553cce25ebd2)",
        "type": [
            "creation"
        ]
    },
    "observer": {
        "product": "Guardicore",
        "type": "bastion",
        "vendor": "Akamai"
    },
    "related": {
        "ip": [
            "192.0.2.1"
        ],
        "user": [
            "admin"
        ]
    },
    "source": {
        "address": "192.0.2.1",
        "ip": "192.0.2.1"
    },
    "user": {
        "name": "admin"
    }
}
{
    "message": "New audit log entry reported by the Guardicore Security Suite;;Username: None;IP Address: 192.0.2.1;;Title: Access to unknown resource;;Description: Access to resource: /api/login with status code: 404",
    "event": {
        "category": [
            "configuration"
        ],
        "dataset": "audit",
        "reason": "Access to resource: /api/login with status code: 404",
        "type": [
            "access"
        ]
    },
    "observer": {
        "product": "Guardicore",
        "type": "bastion",
        "vendor": "Akamai"
    },
    "related": {
        "ip": [
            "192.0.2.1"
        ]
    },
    "source": {
        "address": "192.0.2.1",
        "ip": "192.0.2.1"
    }
}
{
    "message": "New audit log entry reported by the Guardicore Security Suite;;Username: jdoe;IP Address: 192.0.2.1;;Title: Authentication success;;Description: User jdoe authenticated successfully",
    "event": {
        "category": [
            "authentication"
        ],
        "dataset": "audit",
        "outcome": "success",
        "reason": "User jdoe authenticated successfully",
        "type": [
            "start"
        ]
    },
    "observer": {
        "product": "Guardicore",
        "type": "bastion",
        "vendor": "Akamai"
    },
    "related": {
        "ip": [
            "192.0.2.1"
        ],
        "user": [
            "jdoe"
        ]
    },
    "source": {
        "address": "192.0.2.1",
        "ip": "192.0.2.1"
    },
    "user": {
        "name": "jdoe"
    }
}
{
    "message": "New test connection entry reported by the Guardicore Security Suite;;Username: None;IP Address: 192.0.2.10;;Title: Run Data Exporter Integration Test Connections;;Description: Test successful",
    "event": {
        "category": [
            "network"
        ],
        "dataset": "test",
        "outcome": "success",
        "reason": "Run Data Exporter Integration Test Connections",
        "type": [
            "info"
        ]
    },
    "observer": {
        "product": "Guardicore",
        "type": "bastion",
        "vendor": "Akamai"
    }
}
{
    "message": "New low severity security incident reported by the Guardicore Security Suite;;ID: 00000000-0000-0000-0000-000000000000;URL: https://lab.example.com/overview/incidents/00000000-0000-0000-0000-000000000000;;Description: A request was made to an IP address with a bad reputation;;Severity: low;Start Time: 2026-04-07T08:47Z;End Time: 2026-04-07T08:47Z;;Rule ID: No rule;Affected Assets:;192.0.2.1 (source);destination.test.org (destination);;Destination labels: Role: FE;Terraform: True;Worksite: Default;App: CRM;Environment: Development;os_name: Ubuntu 24.04.4 LTS;os_type: Linux;;Tags: Known Phishing, Known Malware;;Summary: ;1. IP address 198.51.100.50:22, communicating with asset destination.test.org (192.0.2.2), was identified as Known Malware and Known Phishing by Guardicore Reputation Service.;Direction: Inbound;",
    "event": {
        "category": [
            "threat"
        ],
        "dataset": "incident",
        "end": "2026-04-07T08:47:00Z",
        "kind": "alert",
        "reason": "1. IP address 198.51.100.50:22, communicating with asset destination.test.org (192.0.2.2), was identified as Known Malware and Known Phishing by Guardicore Reputation Service.",
        "reference": "https://lab.example.com/overview/incidents/00000000-0000-0000-0000-000000000000",
        "start": "2026-04-07T08:47:00Z",
        "type": [
            "info"
        ]
    },
    "@timestamp": "2026-04-07T08:47:00Z",
    "akamai": {
        "guardicore": {
            "incident": {
                "affected_assets": [
                    "192.0.2.1 (source)",
                    "destination.test.org (destination)"
                ],
                "environment": "Development",
                "id": "00000000-0000-0000-0000-000000000000",
                "severity": "low"
            }
        }
    },
    "destination": {
        "address": "destination.test.org",
        "domain": "destination.test.org",
        "registered_domain": "test.org",
        "subdomain": "destination",
        "top_level_domain": "org"
    },
    "host": {
        "os": {
            "full": "Ubuntu 24.04.4 LTS",
            "type": "linux"
        }
    },
    "network": {
        "application": "CRM",
        "direction": "inbound"
    },
    "observer": {
        "product": "Guardicore",
        "type": "bastion",
        "vendor": "Akamai"
    },
    "related": {
        "hosts": [
            "destination.test.org"
        ],
        "ip": [
            "192.0.2.1"
        ]
    },
    "source": {
        "address": "192.0.2.1",
        "ip": "192.0.2.1"
    }
}
{
    "message": "New network connection reported by the Guardicore Security Suite;ID: eac74b0a;Connection type: FAILED; Action: Blocked;Count: 1;Time: 2024-04-03T02:05:40.611Z;Source IP: 192.0.2.1;Source process name: Unknown Client;Source application name: Unknown Client;Destination IP: 192.0.2.2;Destination port: 22;Destination asset name: hostname.local;Destination user name: root;Destination process name: sshd;Destination process path: /usr/sbin/sshd;Destination process name: sshd;Protocol: TCP;Connection verdict: blocked_by_destination;Policy rule: 11234vs-4573-7432-7543-2342gsdf436; Incidents: 11124vs-2342-1231-6543-2342gsdf424",
    "event": {
        "action": "Blocked",
        "category": [
            "network"
        ],
        "dataset": "network",
        "outcome": "failure",
        "type": [
            "denied"
        ]
    },
    "@timestamp": "2024-04-03T02:05:40.611000Z",
    "akamai": {
        "guardicore": {
            "network": {
                "connection_verdict": "blocked_by_destination",
                "destination": {
                    "process": {
                        "name": "sshd",
                        "path": "/usr/sbin/sshd"
                    }
                },
                "id": "eac74b0a",
                "incidents": [
                    "11124vs-2342-1231-6543-2342gsdf424"
                ]
            }
        }
    },
    "destination": {
        "address": "hostname.local",
        "domain": "hostname.local",
        "ip": "192.0.2.2",
        "port": 22,
        "subdomain": "hostname",
        "user": {
            "name": "root"
        }
    },
    "network": {
        "application": "Unknown Client",
        "transport": "tcp"
    },
    "observer": {
        "product": "Guardicore",
        "type": "bastion",
        "vendor": "Akamai"
    },
    "process": {
        "name": "Unknown Client"
    },
    "related": {
        "hosts": [
            "hostname.local"
        ],
        "ip": [
            "192.0.2.1",
            "192.0.2.2"
        ],
        "user": [
            "root"
        ]
    },
    "rule": {
        "id": "11234vs-4573-7432-7543-2342gsdf436"
    },
    "source": {
        "address": "192.0.2.1",
        "ip": "192.0.2.1"
    }
}
{
    "message": "New network connection reported by the Guardicore Security Suite;ID: eac74b0a;Connection type: SUCCESSFUL; Action: Allowed;Count: 1;Time: 2024-04-03T02:05:40.611Z;Source IP: 192.0.2.5;Source process name: Unknown Client;Source application name: Unknown Client;Destination IP: 192.0.2.6;Destination port: 67;Destination asset name: hostname.local;Destination user name: root;Destination process name: sshd;Destination process path: /usr/sbin/dnsmasq;Destination process name: sshd;Protocol: UDP;Connection verdict: allowed;Policy rule: default; Incidents: 11124vs-2342-1231-6543-2342gsdf424",
    "event": {
        "action": "Allowed",
        "category": [
            "network"
        ],
        "dataset": "network",
        "outcome": "success",
        "type": [
            "allowed"
        ]
    },
    "@timestamp": "2024-04-03T02:05:40.611000Z",
    "akamai": {
        "guardicore": {
            "network": {
                "connection_verdict": "allowed",
                "destination": {
                    "process": {
                        "name": "sshd",
                        "path": "/usr/sbin/dnsmasq"
                    }
                },
                "id": "eac74b0a",
                "incidents": [
                    "11124vs-2342-1231-6543-2342gsdf424"
                ]
            }
        }
    },
    "destination": {
        "address": "hostname.local",
        "domain": "hostname.local",
        "ip": "192.0.2.6",
        "port": 67,
        "subdomain": "hostname",
        "user": {
            "name": "root"
        }
    },
    "network": {
        "application": "Unknown Client",
        "transport": "udp"
    },
    "observer": {
        "product": "Guardicore",
        "type": "bastion",
        "vendor": "Akamai"
    },
    "process": {
        "name": "Unknown Client"
    },
    "related": {
        "hosts": [
            "hostname.local"
        ],
        "ip": [
            "192.0.2.5",
            "192.0.2.6"
        ],
        "user": [
            "root"
        ]
    },
    "rule": {
        "id": "default"
    },
    "source": {
        "address": "192.0.2.5",
        "ip": "192.0.2.5"
    }
}
Extracted Fields
The following table lists the fields that are extracted, normalized under the ECS format, analyzed and indexed by the parser. It should be noted that infered fields are not listed.
| Name | Type | Description |
|---|---|---|
@timestamp |
date |
Date/time when the event originated. |
akamai.guardicore.incident.affected_assets |
array |
List of assets affected by the security incident, including their roles (source or destination), as reported by akamai.guardicore. |
akamai.guardicore.incident.environment |
keyword |
Environment label associated with the destination asset involved in the incident (e.g., Development, Production, Staging). |
akamai.guardicore.incident.id |
keyword |
Unique identifier of the security incident reported by akamai.guardicore. |
akamai.guardicore.incident.severity |
keyword |
Severity level of the security incident as reported by akamai.guardicore (e.g., low, medium, high, critical). |
akamai.guardicore.network.connection_verdict |
keyword |
Final verdict of the network connection as determined by akamai.guardicore policy enforcement (e.g., blocked_by_destination, allowed_by_policy). |
akamai.guardicore.network.destination.process.name |
keyword |
Name of the process running on the destination asset that received the network connection. |
akamai.guardicore.network.destination.process.path |
keyword |
Full file system path of the process running on the destination asset that received the network connection. |
akamai.guardicore.network.id |
keyword |
Unique identifier of the network connection event reported by akamai.guardicore. |
akamai.guardicore.network.incidents |
array |
Identifiers of security incidents related to this network connection event, as reported by akamai.guardicore. |
destination.domain |
keyword |
The domain name of the destination. |
destination.ip |
ip |
IP address of the destination. |
destination.port |
long |
Port of the destination. |
destination.user.name |
keyword |
Short name or login of the user. |
event.action |
keyword |
The action captured by the event. |
event.category |
keyword |
Event category. The second categorization field in the hierarchy. |
event.dataset |
keyword |
Name of the dataset. |
event.end |
date |
event.end contains the date when the event ended or when the activity was last observed. |
event.kind |
keyword |
The kind of the event. The highest categorization field in the hierarchy. |
event.outcome |
keyword |
The outcome of the event. The lowest level categorization field in the hierarchy. |
event.reason |
keyword |
Reason why this event happened, according to the source |
event.reference |
keyword |
Event reference URL |
event.start |
date |
event.start contains the date when the event started or when the activity was first observed. |
event.type |
keyword |
Event type. The third categorization field in the hierarchy. |
host.os.full |
keyword |
Operating system name, including the version or code name. |
host.os.type |
keyword |
Which commercial OS family (one of: linux, macos, unix or windows). |
network.application |
keyword |
Application level protocol name. |
network.direction |
keyword |
Direction of the network traffic. |
network.transport |
keyword |
Protocol Name corresponding to the field iana_number. |
observer.product |
keyword |
The product name of the observer. |
observer.type |
keyword |
The type of the observer the data is coming from. |
observer.vendor |
keyword |
Vendor name of the observer. |
process.name |
keyword |
Process name. |
rule.id |
keyword |
Rule ID |
source.domain |
keyword |
The domain name of the source. |
source.ip |
ip |
IP address of the source. |
user.name |
keyword |
Short name or login of the user. |
For more information on the Intake Format, please find the code of the Parser, Smart Descriptions, and Supported Events here.
Troubleshooting
No event is received
In the Akamai Guardicore console, for each data exporter for Sekoia.io, check, in the Message format section:
- The intake is supplied in the
RFC5424 structured dataoption RFC5424is selected asMessage formatISO8601 (including milliseconds)is selected asFormat log timestamp